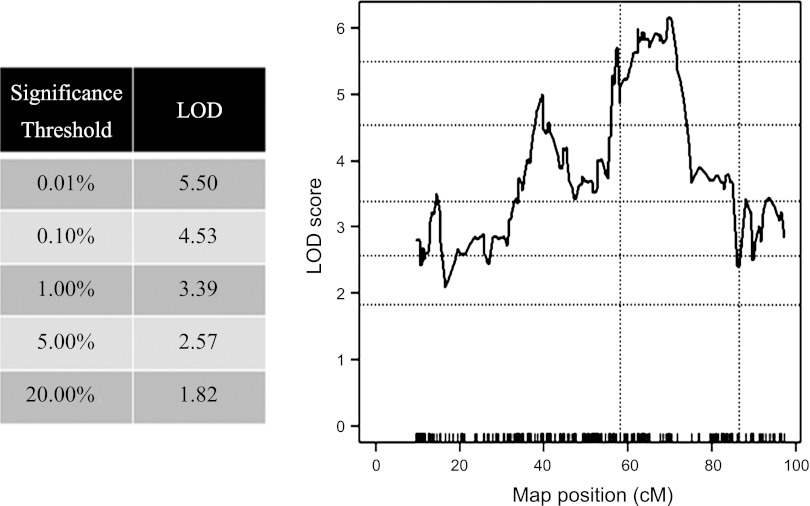
Fig. 3.
Shown are the results of a single-QTL analysis for pause trait expressed as ≤1 of >0 in the 2-min reoxygenation period immediately after the hypoxic exposure. Log-likelihood odds ratio (LOD) plots linking pauses to markers mapped to positions on chromosome 1 among F2 offspring. Significance thresholds (Table) were determined by 100,000 permutation test. Peak LOD (6.15) is located at 69.9 cM (marker rs6239070). Dotted vertical lines indicate region introgressed from the B6 onto the B6a1 genetic background to generate the B6a1.B6-(rs30880354-rs6157620) congenic strain.

