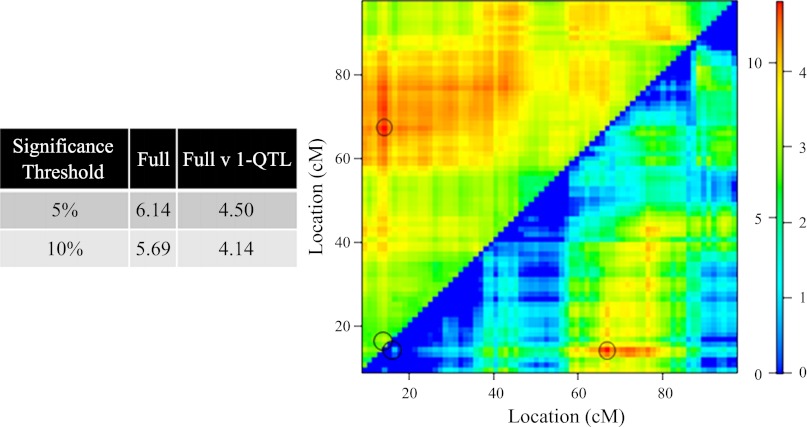
Fig. 4.
This is a heatmap representation of a full two-QTL models, in which epistasis (interaction) is allowed. LOD associated with the full model (LODfull) are plotted in the top left triangle. LODfull v. 1-QTL, plotted in the bottom right triangle, demonstrates the improvement of the full model over all possible single-QTL models. Numbers on the left and right of color scale correspond to LODfull and LODfull v. 1-QTL significance levels, respectively. Significance thresholds were determined by performing a 10,000 permutation test. Noted by the circles are peak LODfull of 11.9 and LODfv1 of 4.92 located QTL at 14.3 and 67.0 cM, respectively. For more information, see text.

