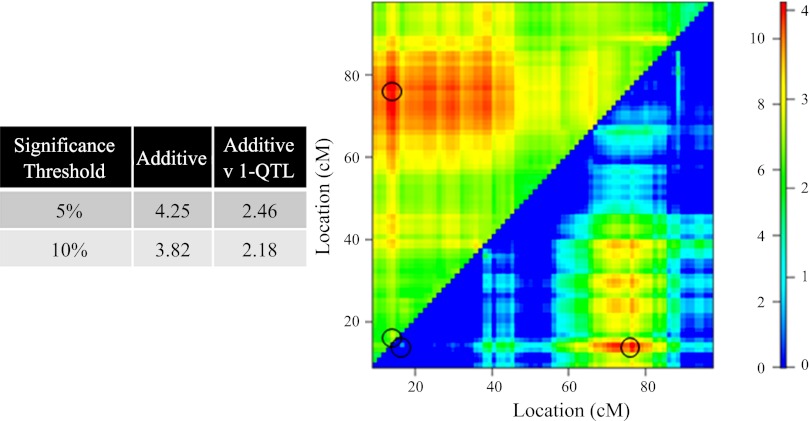
Fig. 5.
The figure is set up similarly to Fig. 4. It illustrates the impact by which two loci independently contribute to phenotype compared with a conventional QTL. Log-likelihood associated with the additive model (LODadditive) are plotted in the top left triangle. LODadditive v. 1-QTL is plotted in the bottom right triangle, and the figure demonstrates the improvement of the additive model over all possible single-QTL models. Numbers on the left and right of color scale correspond to LODadditive and LODadditive v. 1-QTL, respectively. Significance thresholds were determined by performing a 10,000 permutation test. Indicated by a circle are the maximum LODadditive score of 11.1 and LODadditive v. single-QTL score of 4.08, identifying 14.3 and 76.7 cM on mouse chromosome 1 as loci of interest. For more information, see text.

