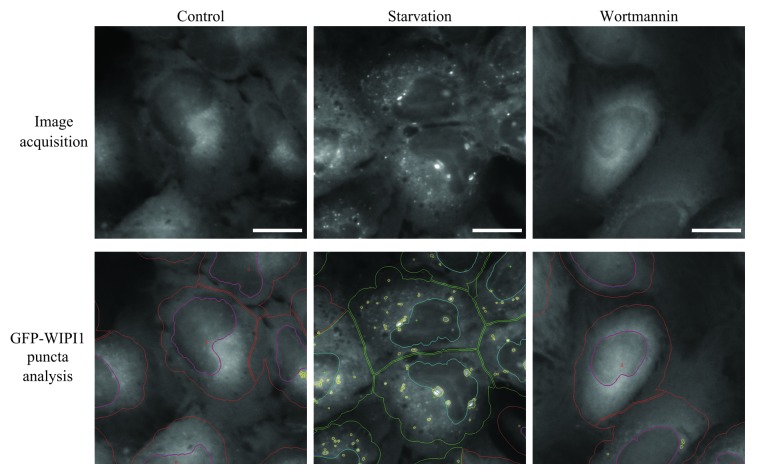
Figure 17. Automated WIPI1 puncta image acquisition and analysis monitors the induction and inhibition of autophagy. Stable U2OS clones expressing GFP-WIPI1 were selected using 0.6 μg/ml G418 and then cultured in 96-well plates. Cells were treated for 3 h with nutrient-rich medium (control), nutrient-free medium (EBSS), or with 233 nM wortmannin. Cells were fixed in 3.7% paraformaldehyde and stained with DAPI (5 μg/ml in PBS). An automated imaging and analysis platform was used to determine the number of both GFP-WIPI1 puncta-positive cells and the number of GFP-WIPI1 puncta per individual cell.348 Cells without GFP-WIPI1 puncta are highlighted in red (cell detection) and purple (nuclei detection), whereas GFP-WIPI1 puncta-positive cells are highlighted in yellow (GFP-WIPI1 puncta detection), green (cell detection) and blue (nuclei detection). Bars, 20 µm. These images were provided by S. Pfisterer and T. Proikas-Cezanne.

An official website of the United States government
Here's how you know
Official websites use .gov
A
.gov website belongs to an official
government organization in the United States.
Secure .gov websites use HTTPS
A lock (
) or https:// means you've safely
connected to the .gov website. Share sensitive
information only on official, secure websites.
