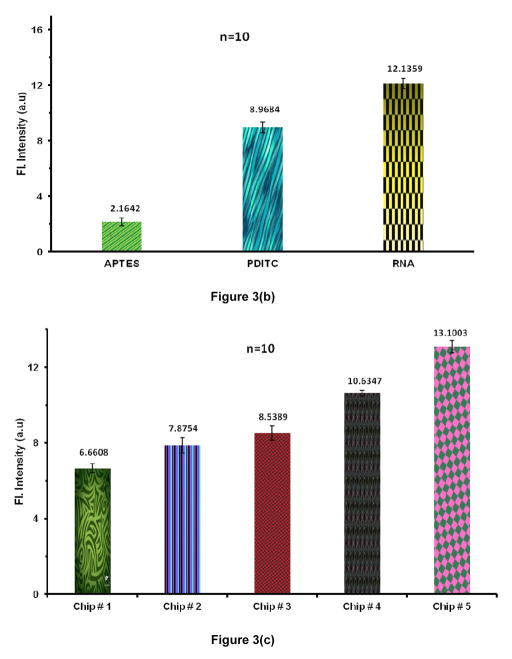
Figure 3.
(a) Acridine Orange (AO) stain intensity measurements (background subtracted) depicts the presence of surface-bound DNA by comparing it with control chips. (n=10). (b) Fluorescence intensity measurements (background subtracted) using AO confirms the RNA hybridization to surface bound ssDNA when compared to control chips (n=10). (c) Sypro staining shows the selective capture of EGFR on functionalized SiO2. From L to R: Chip # 1: Control chip treated with blocking buffer (BB) but no aptamer; Chip # 2: Control chip with no BB treatment and no aptamer; Chip # 3: Control chip functionalized with mutant aptamer and treated with BB; Chip # 4: Functionalized chip with EGFR aptamer and captured protein after BB treatment; Chip # 5: Functionalized chip with EGFR aptamer and captured protein without using BB. (Error bars represent the standard deviation for n = 10)


