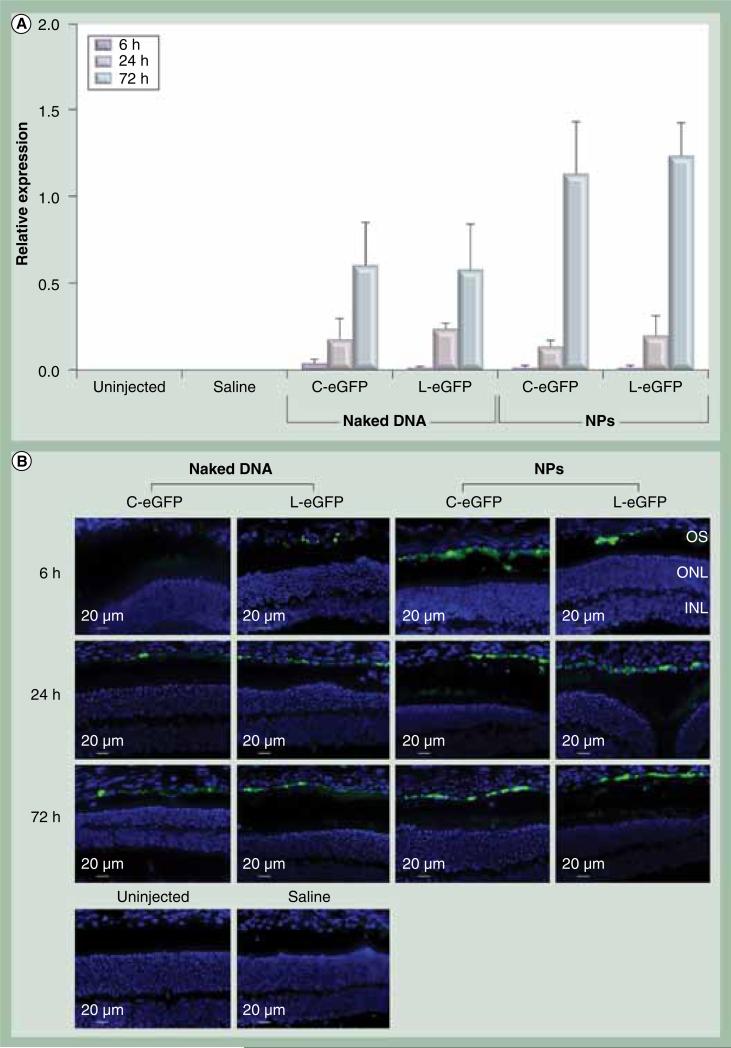
Figure 5. Ocular expression and enhanced GFP localization post second subretinal injection.
(A) Quantitative real-time PCR of GFP mRNA was quantified relative to endogenous β-actin at 6, 24 and 72 h PI after the second injection of C- or L-eGFP expression DNA as either naked DNA or NPs. Saline and uninjected eyes were used as negative controls. The increase in eGFP expression levels from 24 to 72 h PI was significant for naked and NP-treated eyes with both vectors. A value of p < 0.05 was considered statistically significant. Error bars show standard deviation from four independent experiments and each was run in triplicate. (B) Direct eGFP in rentinal pigmented epithelial cell layer at the site of injection and for the same time points presented in (A).
C-eGFP: Circular enhanced GFP; INL: Inner nuclear layer; L-eGFP: Linear enhanced GFP; NP: Nanoparticle; ONL: Outer nuclear layer; OS: Outer segment.

