Figure 2.

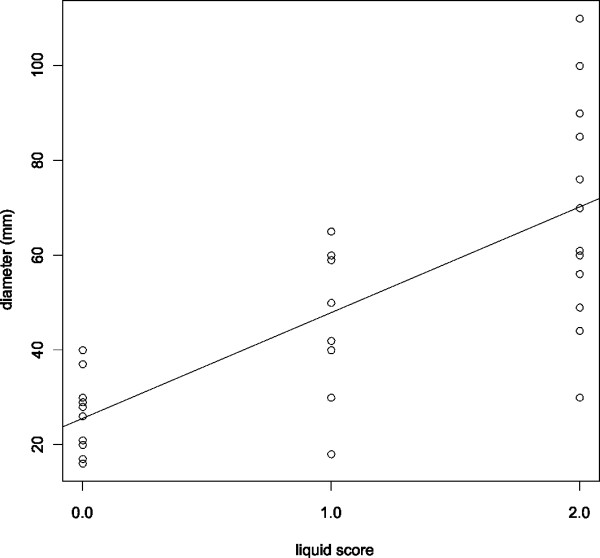
Liquid score and diameter. The correlation of the liquid score and diameter of the necrosis is shown in this scatter-plot. The line corresponds to the fitted linear model (F-statistic, p-value: 1.59 × 10⁻⁶).

Liquid score and diameter. The correlation of the liquid score and diameter of the necrosis is shown in this scatter-plot. The line corresponds to the fitted linear model (F-statistic, p-value: 1.59 × 10⁻⁶).