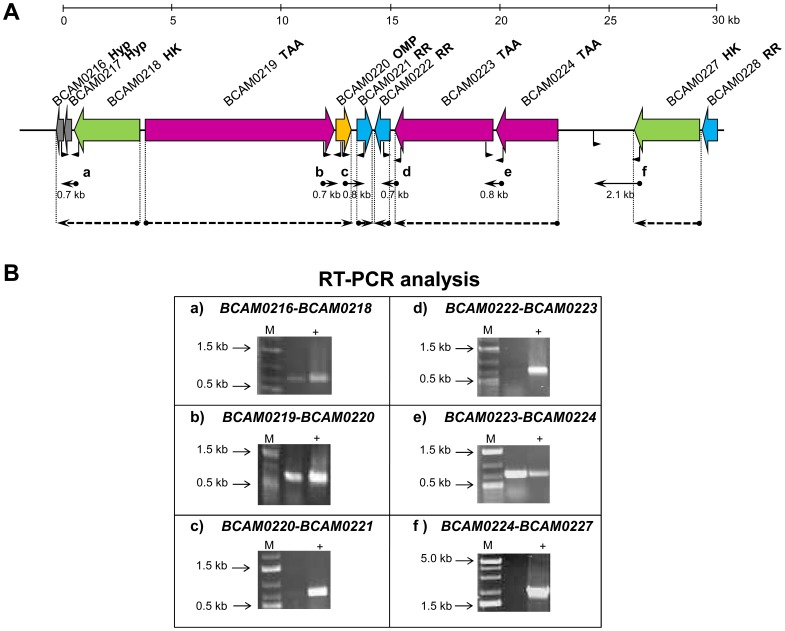
Figure 1. Gene organization of the TAA gene cluster in B. cenocepacia K56-2. A.
) Genomic organization and operon mapping of the TAA gene cluster. The regions amplified by RT-PCR are indicated by filled arrows and the respective primers location is shown in the genes. The regions co-transcribed are identified with dashed arrows. Hyp – hypothetical protein, HK- histidine kinase, TAA – trimeric autotransporter adhesin, OMP – outer membrane protein, RR – response regulator. B) Results from the RT-PCR analysis, showing that no amplification was obtained for regions c), d) and f). Regions a), b) and e) showed amplification indicating that genes are co-trasncribed. Genomic DNA was used as positive control (+). A negative control was performed with RNA without reverse transcriptase, and the result was always negative. M, molecular mass marker.

