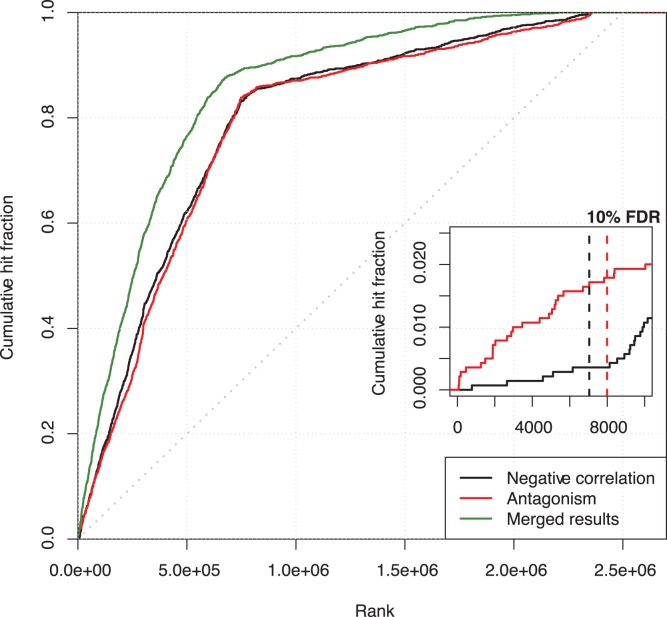
Figure 4. The cumulative frequence of predicted true interactions (hits) plotted as a function of the prediction rank obtained by antagonism pattern and by linear anti-correlation.
Merged results show the benefit obtained by the combination of the two methods, obtained by taking the best rank between the two methods for each predicted miRNA-target pair.

