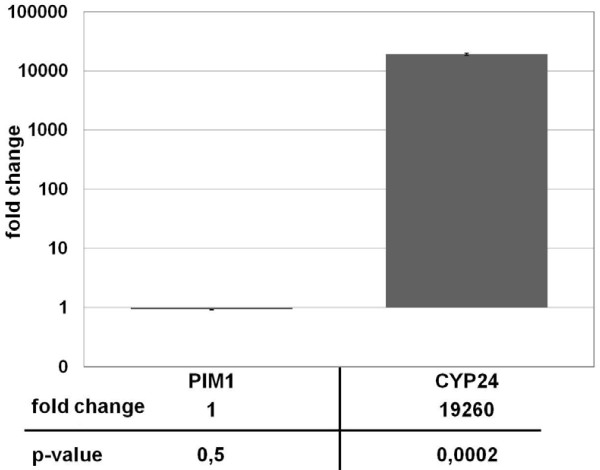
Figure 4.
Real-Time analysis of PIM-1 trancription in human keratinocytes upon calcitriol stimulation. HaCAT cells were induced either with 0.2 μM calcitriol or with an equal amount of ethanol for 16 h. Levels of gene expression were analyzed by Real-Time PCR, and are shown as fold change differences between vehicle and calcitriol induction relative to the housekeeping gene ANXA1. The expression levels of PIM-1 show no significant differences between calcitriol and ethanol induction (p-value = 0,5), whereas CYP24A1 gene expression shows an enormous increase with calcitriol induction (p-value = 0.0002). Error bars represent the standard error of the mean (SEM) of n = 3 values.

