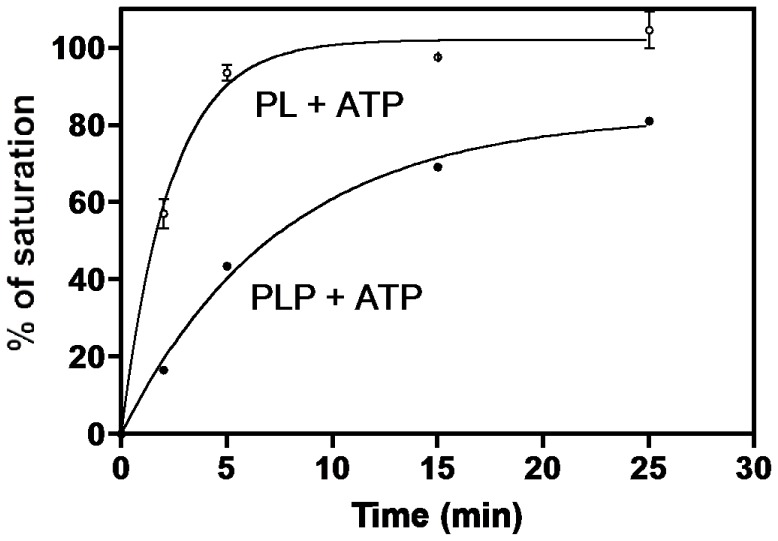
Figure 4. Rate of formation of ePL kinase•PLP complex.
To a series of 100 µl solutions in Eppendorf vials containing 0.4 mM MgATP, 0.20 mM MgCl2 and either 0.150 mM PL or 0.150 mM PLP at 37°C was added 9 nmoles of ePL kinase (90 µM). After 2, 5, 15 and 25 min contents of vials were withdrawn and placed on small Sephadex G-50 columns at 4°C equilibrated with 1 mM MgATP and 0.2 mM MgCl2 (see Experimental Procedures) to separate bound and free PLP. The eluate of each column was 400 µl. Spectra were recorded and the absorbance at 420 nm determined. Open circles, reactions initiated with PL, closed circles reactions initiated with PLP. The lines through the experimental points are those obtained from nonlinear least squares fittings of data to an exponential equation which gave rate constants of 0.4 min−1 and 0.1 min−1 and amplitudes of 100% and 83% for the experiments initiated with PL and PLP, respectively.

