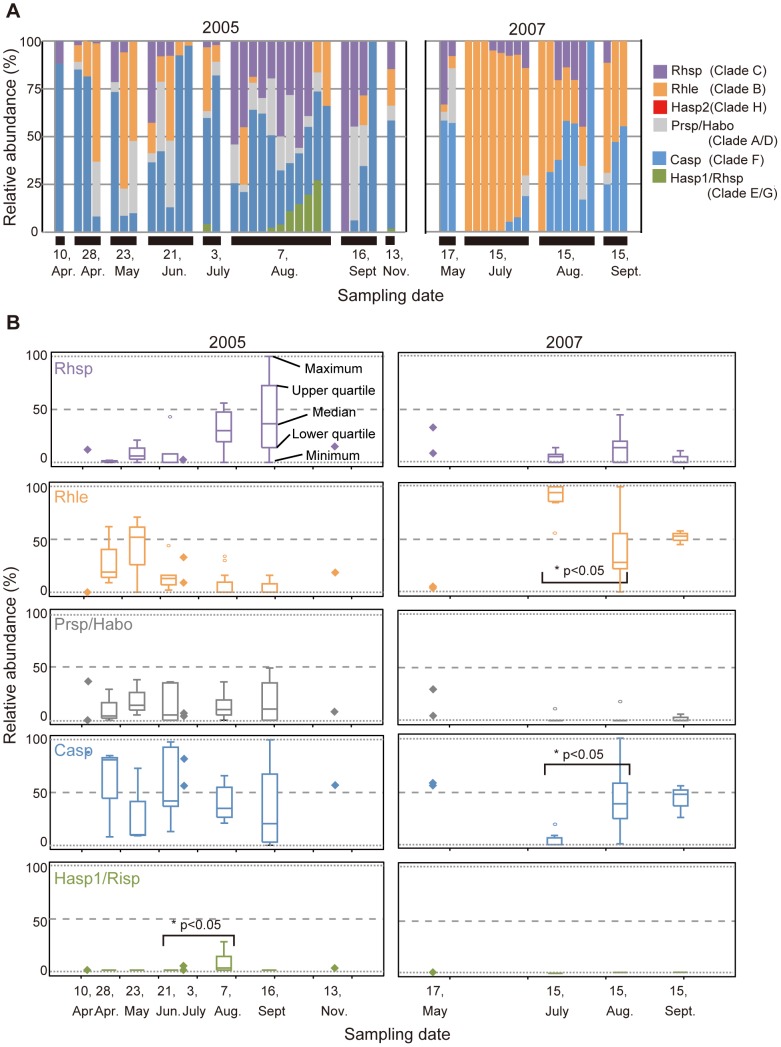
Figure 4. Time series of rbcL sequence composition in Plakobranchus ocellatus.
(A) Relative abundance of respective rbcL in individuals of Plakobranchus ocellatus collected monthly in 2005 and 2007. Source algae of kleptoplasts are shown by abbreviations of the clades (Table 2). (B) Tukey's boxplots of the relative abundance of rbcL sequences. Data points of fewer than three individuals of P. ocellatus are shown as diamonds. The brackets with “*” indicate a significant difference of the percentage value in the permuted Brunner-Munzel test. The value beside the symbol “*” indicates p-value.

