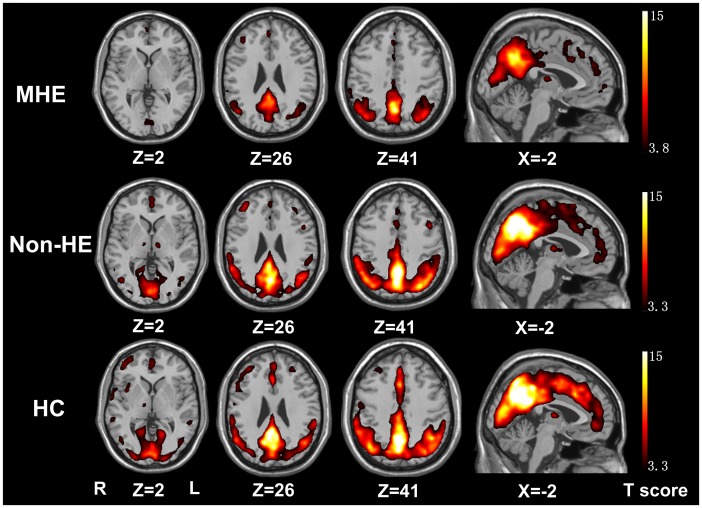
Figure 1. Mean ReHo maps within the MHE, non-HE and healthy control groups (P<0.01, FDR corrected).
The PCC/precuneus, MPFC and bilateral IPL exhibit significantly higher ReHo values than the global mean ReHo value within each group, but with a different strength among the groups. MHE = minimal hepatic encephalopathy; non-HE = non-hepatic encephalopathy; ReHo = regional homogeneity; FDR = false discovery rate; PCC = posterior cingulate cortex; MPFC = medial prefrontal cortex; IPL = inferior parietal lobe.

