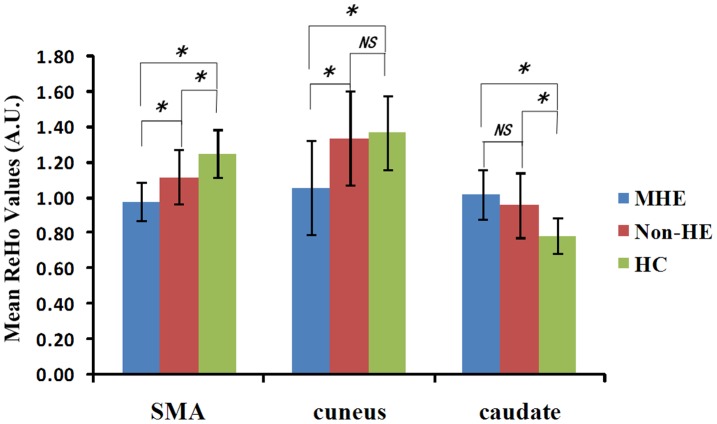
Figure 3. The mean ReHo values of the cuneus, SMA, caudate among the three groups.
The mean ReHo values of the cuneus show a decreasing trend of ReHocontrols (1.37±0.25) > ReHonon-HE (1.34±0.23) > ReHoMHE (1.08±0.24) (F = 8.263, P = 0.001). The mean ReHo values of the caudate show an increasing trend of ReHocontrols (0.81±0.06) < ReHonon-HE (0.96±0.08) < ReHoMHE (1.03±0.17) (F = 25.317, P<0.001). The mean ReHo values of the SMA progressively decrease from controls (1.22±0.12) to non-HE (1.11±0.13) to MHE (1.01±0.15) (all P<0.05, Bonferroni corrected). ReHo = regional homogeneity; A.U. = arbitrary unit; SMA = supplementary motor area; MHE = minimal hepatic encephalopathy; Non-HE = non-hepatic encephalopathy; HC = healthy control; NS = no significance. *represents for P<0.05 (Bonferroni corrected).

