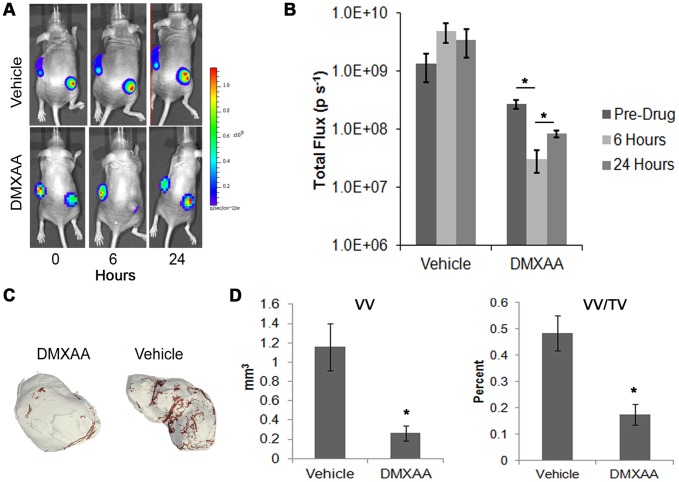
Figure 6. Validation of VDA with a human cell line.
(A) Bioluminescence images taken just prior to DMXAA treatment, as well as at 6 and 24 hrs post treatment of NIH-III mice bearing subcutaneous tumors composed of luciferase-expressing MDA-MB-231 breast cancer cells. (B) Quantification of the photon flux from representative tumors demonstrates a large drop in bioluminescent signal by 6 hours. (C) 3-D micro-CT renderings of tumors (gray), and embedded vasculature (red), of the MDA-MB-231-Luc2 tumors. (D) Quantification of the binarized images demonstrating vessel volume (VV), and vessel density (VV/TV). Data represents averages ± s.e.m. (N = 3), asterisks indicate p<0.05.

