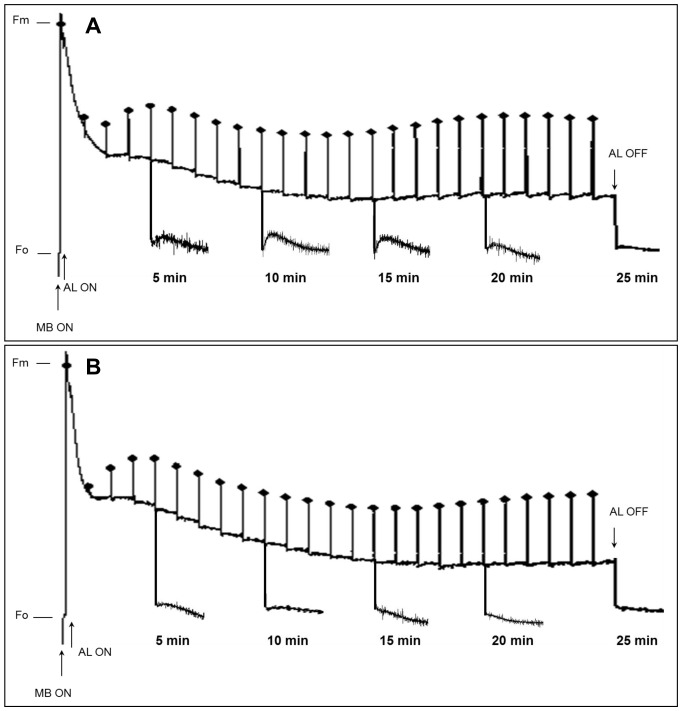
Figure 5. Changes in post-illumination Fo rise at various time points during fluorescence induction.
WT and Cr-PTOX1-I plants were grown at low light (50 µmol photons m−2 s−1). 10-week-old plants were then analysed for post-illumination Fo rise. Dark-adapted WT (A) and Cr-PTOX1-I (B) leaves were illuminated by 96-µmol photons m−2 s−1 white light (AL) for various time points over a period of 30 min. Post-illumination fluorescence kinetics was monitored by placing leaves in the dark for 5 min after illuminating leaves for 5, 10, 15, 20 and 25 min. Saturating flashes of 1000 µmol photons m−2 s−1, 600 ms duration each at 1 min interval were applied throughout the period (24 measurements). Abbreviations: AL = Actinic light, MB = Measuring Beam, Fm = Maximum fluorescence from dark-adapted leaves after saturating flash, Fo = minimum fluorescence in dark-adapted leaves before illumination.

