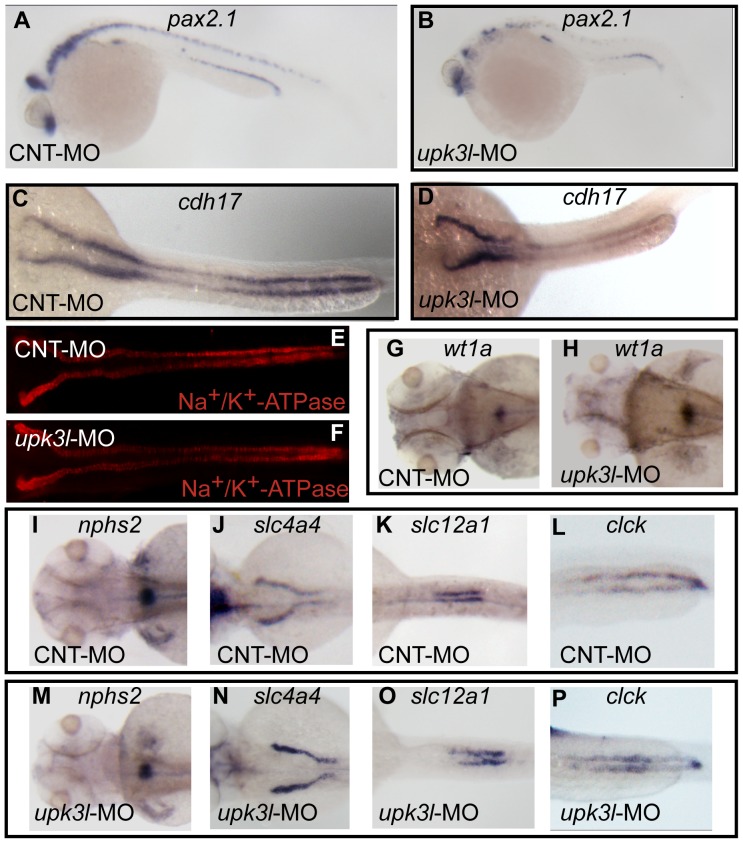
Figure 4. Pronephric morphogenesis, patterning, and segmentation in control and morphant embryos.
(A–D) Expression of pax2.1 in 1-dpf embryos or cdh17 in 2-dpf embryos as revealed by in situ hybridization. (E, F) Low magnification overview of Na+/K+-ATPase expression in the PTs of 2-dpf control or morphant embryos. (G–P) Expression of wt1a (G–H), nph2s (I, M), slc4a4 (J,N), slc12a (K, O) or clck (L, P) in control or morphant 3-dpf embryos.

