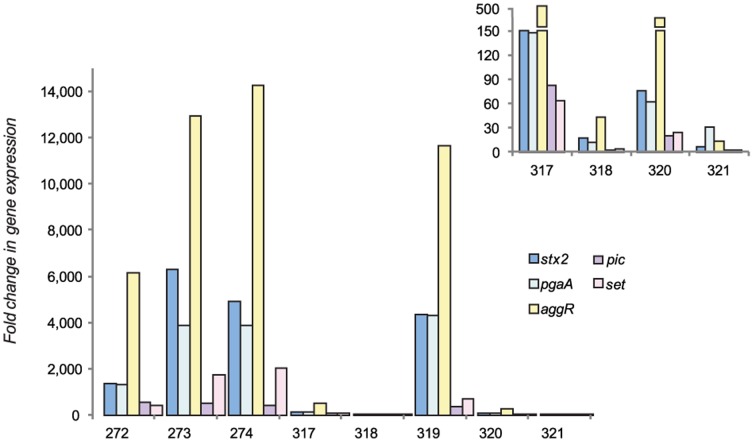
Figure 3. Variation in bacterial gene expression among mice challenged with E. coli O104:H4 for 13–15 days.
Y-axis represents the fold change in cecal gene expression levels among eight mice infected with E. coli O104:H4 at 13–15 days post infection relative to mice infected for seven days. The inset highlights the four mice with fold change values that cannot be visualized using the y-axis in the larger histogram. Broken bars indicate a large change in the y-axis value, while the x-axis refers to the mouse identification number.

