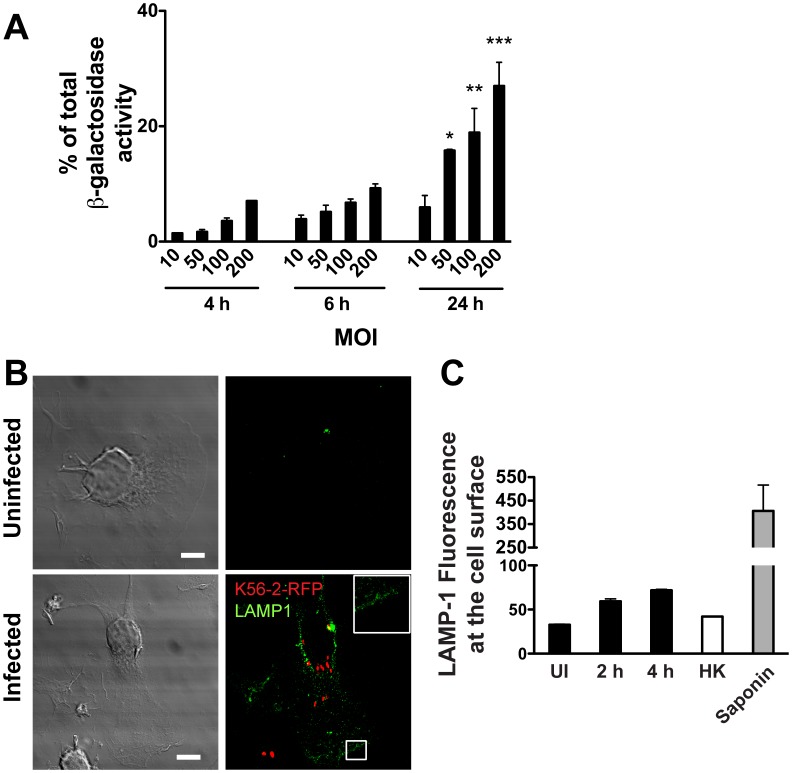
Figure 3. B. cenocepacia infection induces plasma membrane damage. Graphs represent mean ± SEM from three independent experiments.
A. Macrophages were infected with B. cenocepacia at different MOI for 1 h and then treated with gentamicin to eliminate extracellular bacteria. The β-galactosidase activity was quantified from supernatants of infected macrophages at 4, 6 and 24 h post-infection. * p≤0.05; ** p≤0.01 and *** p≤0.001 values for MOI of 10 at 24 h post-infection. B. Macrophages were infected with B. cenocepacia K56-2-RFP (red) for 4 h. Unpermeabilized cells were fixed and stained with anti-LAMP-1 antibodies (green). Representative confocal z slice is shown. Inset is higher magnification of the boxed area. Scale bars are 10 µm. C. Macrophages were infected with B. cenocepacia K56-2 for 2 or 4 h. The cells were stained without permeabilization with anti-LAMP-1 antibodies (green) and analyzed by flow cytometry. The graph shows the mean intensity of fluorescence (MIF) of LAMP1 in the cell surface. UI, uninfected macrophages; HK, macrophages infected with heat-killed bacteria; saponin, macrophages permeabilized with saponin.

