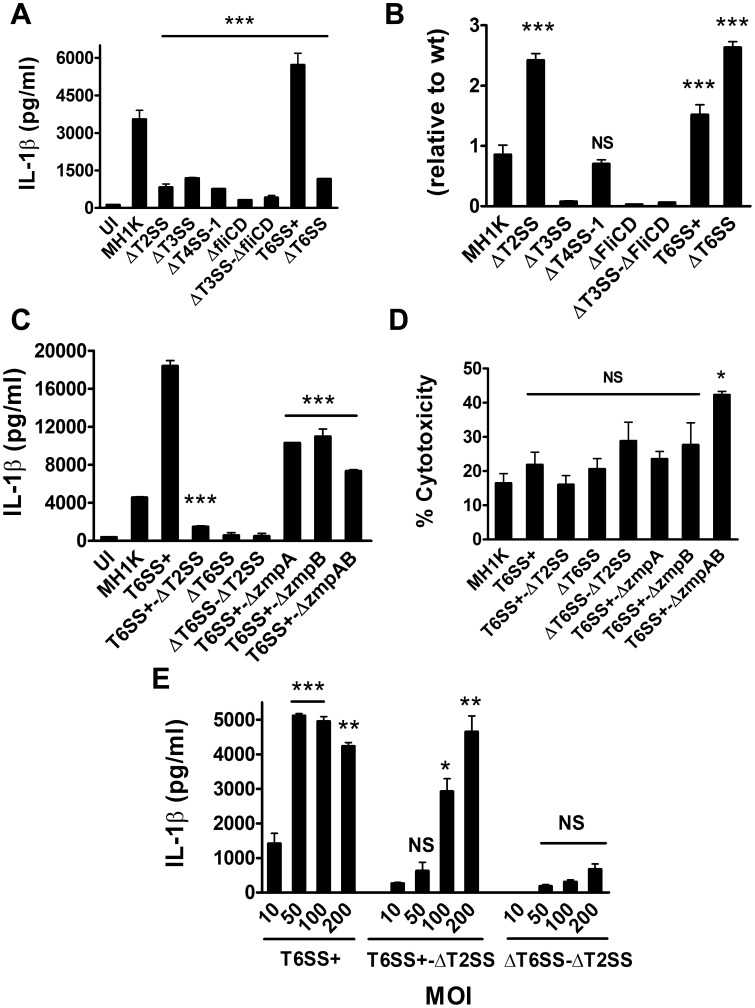
Figure 4. B. cenocepacia-induced macrophage IL-1β secretion through cooperation between the T6SS and the T2SS.
Graphs represent mean ± SEM from three independent experiments. A. Macrophages were infected with B. cenocepacia-MH1K, ΔT2SS, ΔT3SS, T4SS-1, ΔfliCD, ΔT3SS-ΔfliCD, T6SS+ or ΔT6SS at an MOI of 50 for 1 h and extracellular bacteria removed with gentamicin. ELISA was used to quantify IL-1β in cell supernatants at 24 h post-infection. ***, p≤0.001 compared to macrophages infected with MH1K. B. Macrophages were infected as in (A). At 1 h post-infection, the cells were lysed and CFUs were determined. The Invasion Index was calculated relative to MH1K. ***, p≤0.001 values compared to macrophages infected with MH1K; NS, non significant. C. Macrophages were infected as in (A) with B. cenocepacia MH1K, T6SS+, T6SS+-ΔT2SS, ΔT6SS, ΔT6SS-ΔT2SS, T6SS+-ΔzmpA, T6SS+-ΔzmpB or T6SS+-ΔzmpAB. ELISA was used to quantify IL-1β in cell supernatants at 24 h post-infection. ***, p≤0.001 values compared to macrophages infected with T6SS+. D. Macrophages were infected with the same bacterial strains as in (C). Supernatants of infected macrophages were used to quantify the total LDH activity at 24 h post-infection. *, p≤0.05 values compared to macrophages infected with MH1K; NS, non significant. E. Macrophages were infected with T6SS+, T6SS+-ΔT2SS and ΔT6SS-ΔT2SS at different MOI for 1 h and then treated with gentamicin to remove extracellular bacteria. ELISA was used to quantify IL-1β in cell supernatants at 24 h post-infection. *, p≤0.05; **, p≤0.01 and ***, p≤0.001 values compared to macrophages infected with B. cenocepacia mutants at an MOI of 10. NS, non significant.

