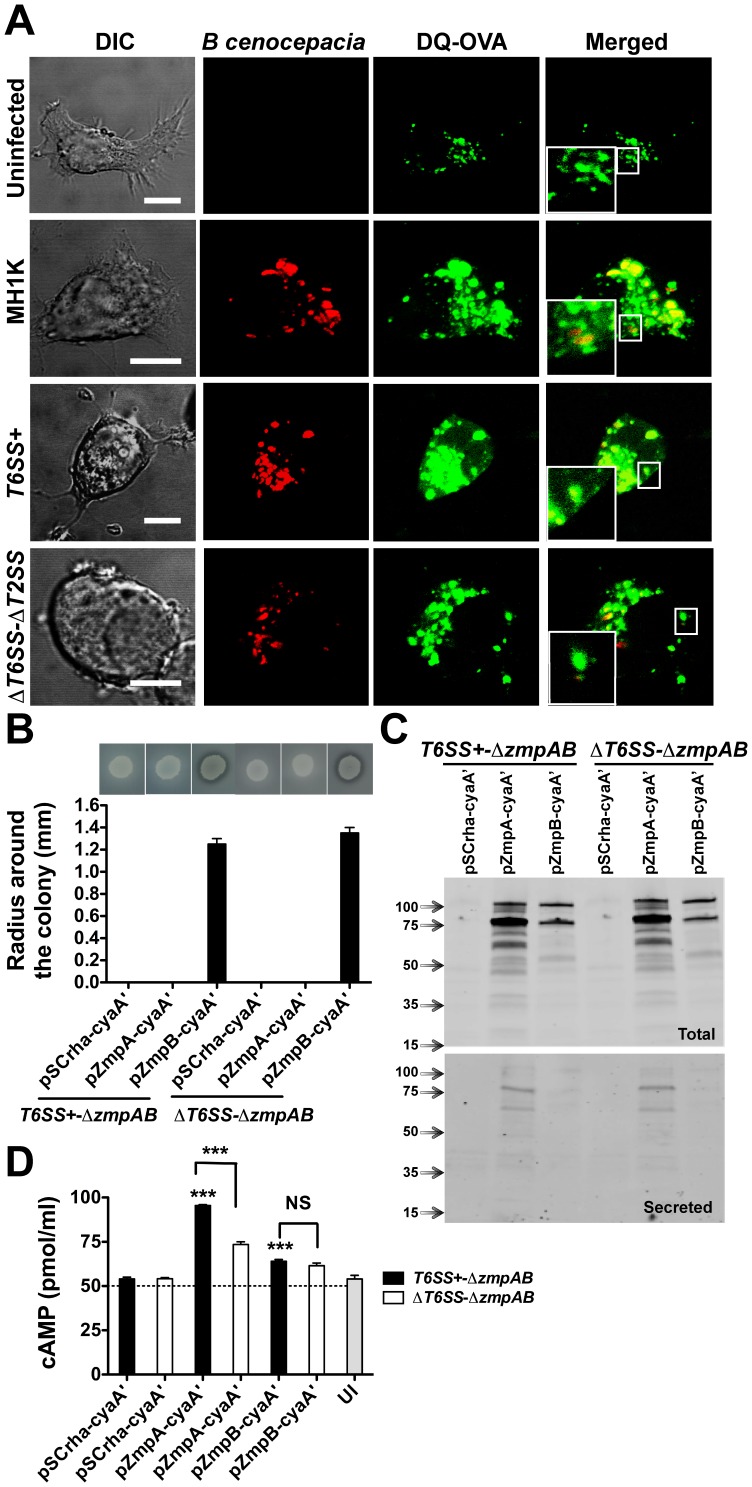
Figure 6. BcCV membrane disruption and translocation of T2SS-secreted proteins ZmpA and ZmpB into the cytosol of infected macrophages.
A. Preloaded macrophages with DQ-OVA (Green) were infected with B. cenocepacia MH1K-, T6SS+- and ΔT6SS-ΔT2SS-RFP (Red) for 6 h. The cells were analyzed by confocal microscopy. Insets are higher magnifications of the boxed areas. Bars represent 10 µm. B. B. cenocepacia T6SS+-ΔzmpAB and ΔT6SS-ΔzmpAB were transformed with pSCrha-cyaA’, pZmpA-cyaA’ and pZmpB-cyaA’. The culture used to infect macrophages was induced with 0.2% of rhamnose for 1 h to allow expression of the protein fusion under the control of the rhamnose-inducible promoter. The functionality of the fusion proteins was tested for proteolysis of casein-D-BHI agar-plates at 37°C over 24 h. Image at the top of the graph shows the radius of proteolysis around the colony. Graph represents mean ± SEM from two independent experiments. C. B. cenocepacia T6SS+-ΔzmpAB and ΔT6SS-ΔzmpAB were transformed with pSCrha-cyaA’, pZmpA-cyaA’ and pZmpB-cyaA’ and grown in 25 ml of LB medium in the presence of 0.02% rhamnose for 3 h. The supernatants were precipitated with TCA and the proteins were resolved in SDS-PAGE and analyzed by western blotting. Blots were probed with anti-cyaA’ antibodies. D. Macrophages were infected for 4 h with induced B. cenocepacia T6SS+-ΔzmpAB and ΔT6SS-ΔzmpAB transformed with pSCrha-cyaA’, pZmpA-cyaA’ and pZmpB-cyaA’ plasmids. Infected cells were lysed to measure cAMP generation. *** p≤0.001, values compared to macrophages infected with T6SS+-ΔzmpAB(pCyaA’). NS, non-significant.

