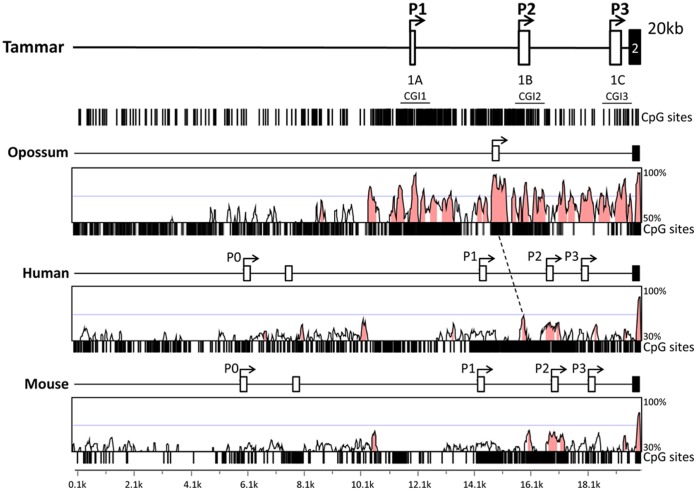
Figure 2. Genomic structure of tammar IGF2 including 3 TSS and comparison with mouse, human and opossum genomes.
Opossum (clone XX-223O16 ch5∶102112-82113), human (ch11∶2156597-2176597) and mouse (ch7∶149841559-149861559), IGF2 base genomes were aligned to tammar IGF2 (clone MEKBa-346C2∶62540-82539). VISTA pairwise alignments using a 100 bp sliding window was performed between each species and tammar. Pink peaks represent areas of conservation of 70% over a minimum of 100 bp between tammar and opossum and 55% over a minimum of 50 bp between tammar and human or mouse. A dotted line indicates a region with 70% conservation between P1 and P2 in both marsupials and eutherians. A schematic of each IGF2 gene is located above the VISTA plot to show relative location of the non-coding exons (open box), including the non-coding exons transcribed with the P0 TSS [12], and coding exons (black box). Location of CpG sites are represented by vertical black bars below the VISTA plot.

