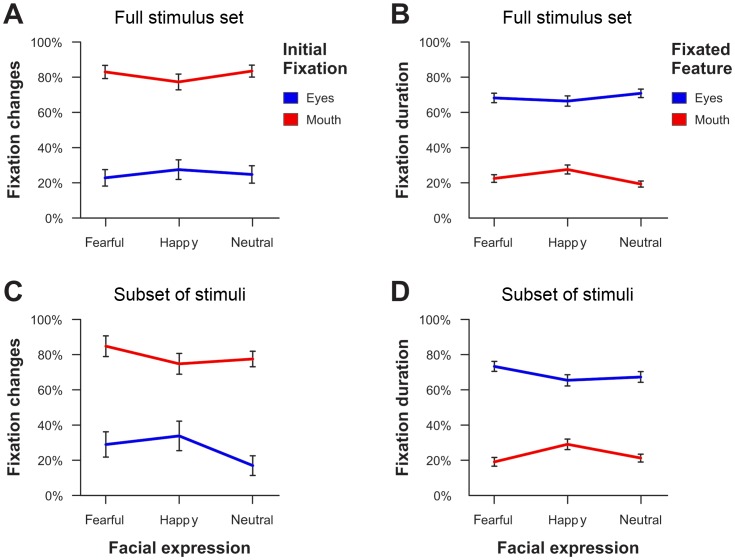
Figure 4. Illustration of the modulatory effect of facial expression on fixation changes (A,C) and fixation durations (B,D) across all experimental tasks and presentation times (Experiment 1).
The upper panels (A,B) show the values for the whole stimulus set whereas the lower panels (C,D) only depict the respective values for a subset of faces with a comparable saliency ratio in the eye as compared to the mouth region. Error bars indicate standard errors of the mean.

