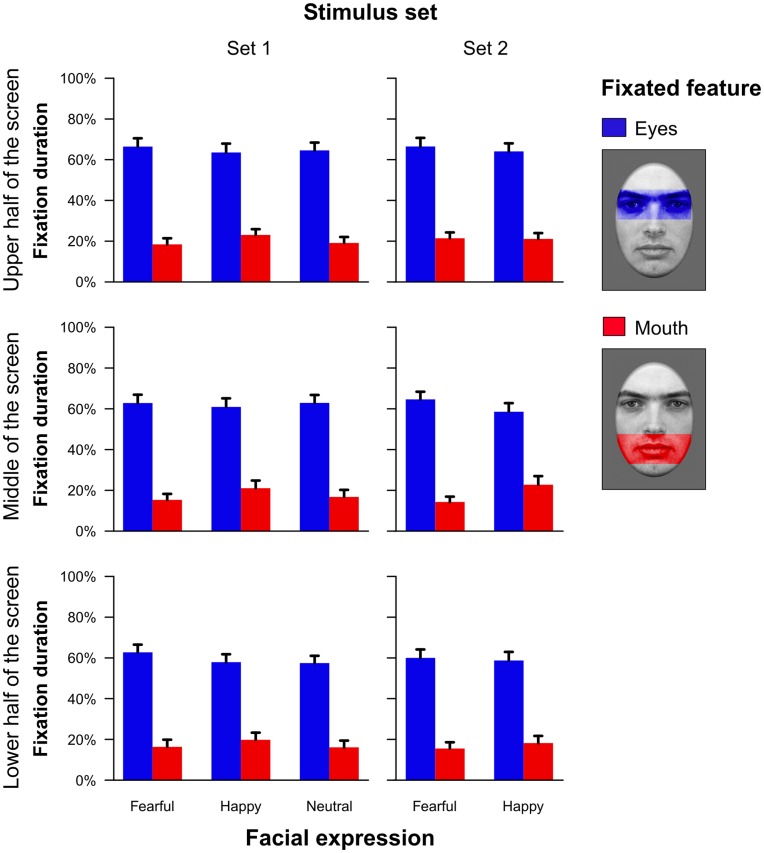
Figure 8. Proportion of time spent fixating either the eye or the mouth region in relation to the time subjects spent fixating the overall face (Experiment 2).
Mean proportions for fixations on the eye or mouth region are shown as a function of the position in the visual field and the facial expression. Results are depicted separately for a stimulus set with a similar saliency ratio of the eye as compared to the mouth region across facial expressions (stimulus set 1) and for a stimulus set with a saliency ratio of approximately 1 (stimulus set 2). The regions of interest that were used to define fixations in the eye or mouth region, respectively, are shown on the right side. Error bars indicate standard errors of the mean.

