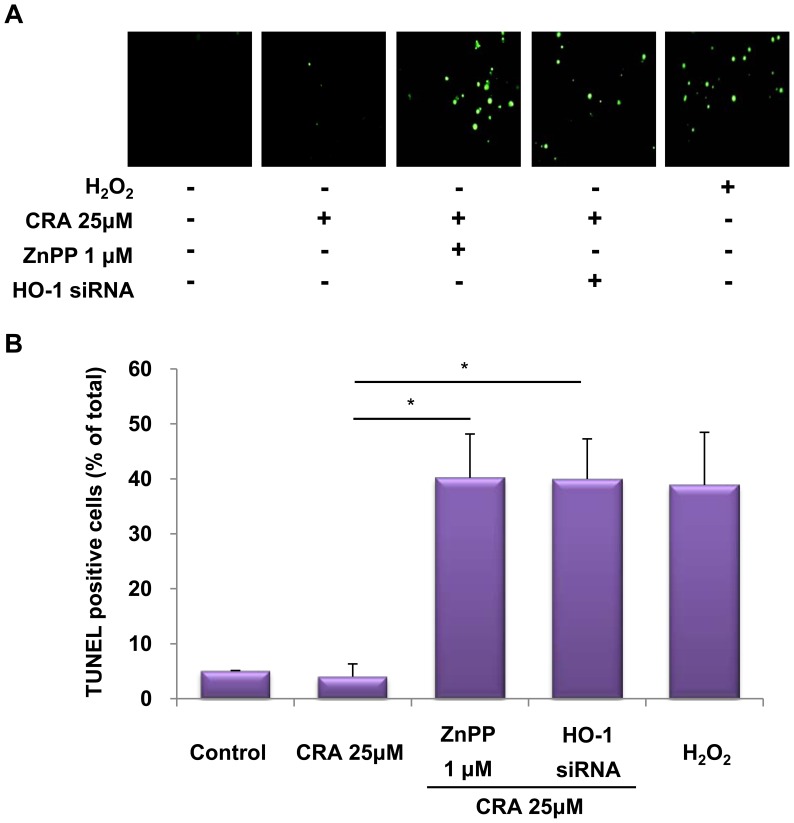
Figure 6. Effect of crotonaldehyde-induced HO-1 inhibition on cell death.
Cells were incubated in the absence or presence of ZnPP or HO-1 siRNA for 16 h before the indicated tests were performed. Crotonaldehyde-stimulated HepG2 cells were pretreated for 1 h with 1 µM ZnPP or HO-1 siRNA. Protective effect of HO-1 induction on cell death as determined by in situ terminal nick end-labeling (TUNEL). Treatment with H2O2 (0.5 mM) served as a positive control. Representative images illustrating fluorescent TUNEL (green) staining of cells cultured for 16 h before the indicated tests were performed (A). The graph indicates that inhibition of HO-1 expression in crotonaldehyde-stimulated HepG2 cells show a significant increase in the number of TUNEL-positive cells compared with those of normal and crotonaldehyde-treated cells (B). TUNEL-positive cells were quantified in five random fields in each culture well, and converted in percentages by referring to the total number of cells. Data represent the mean ± SD of three independent experiments. *p<0.005 vs. CRA 25 µM treated cells.

