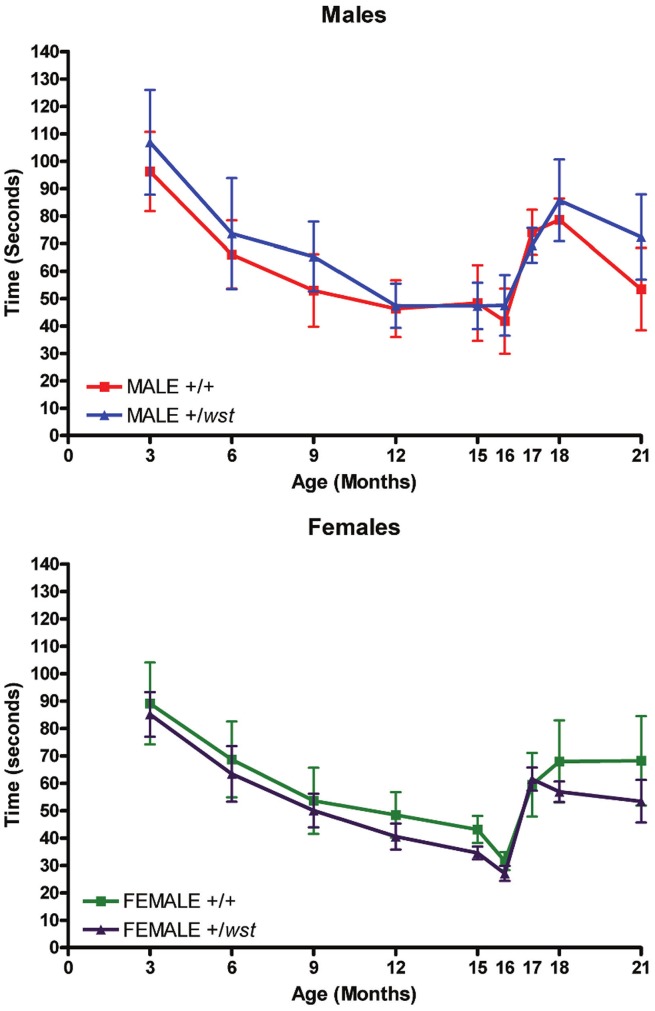
Figure 1. Rotarod analysis of aged mice.
Mean times of latency to fall from the rotarod over the 21 months of the ageing study. WT indicates wild-type animals, HET indicates heterozygote animals. The upper graph shows data from the male groups and the lower graph shows data from the female groups. Error bars represent the standard error of the mean.

