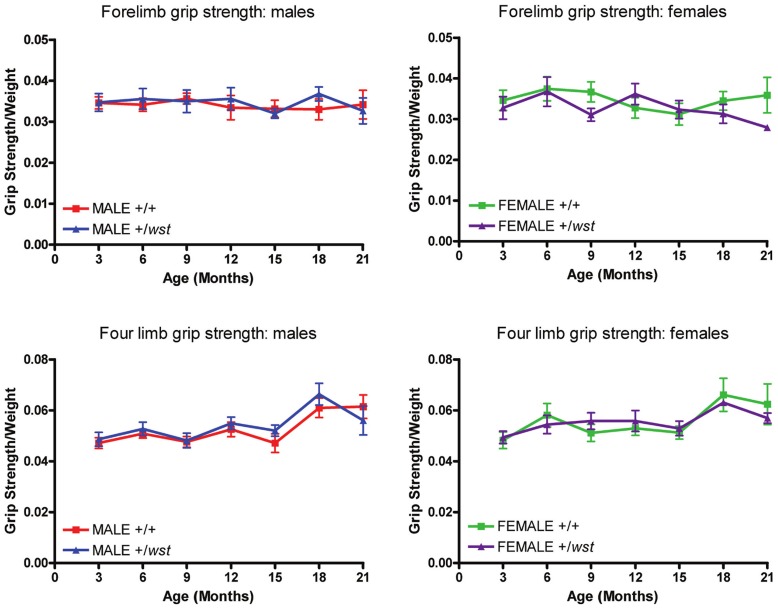
Figure 3. Grip strength analysis of aged mice.
Grip strength data for the entire ageing study. Graphs on the left display male data and graphs on the right display female data. Top graphs display forelimb data only and the bottom 2 graphs display data from all four limbs. WT indicates wild-type animals, HET indicates heterozygote animals. Error bars represent the standard error of the mean.

