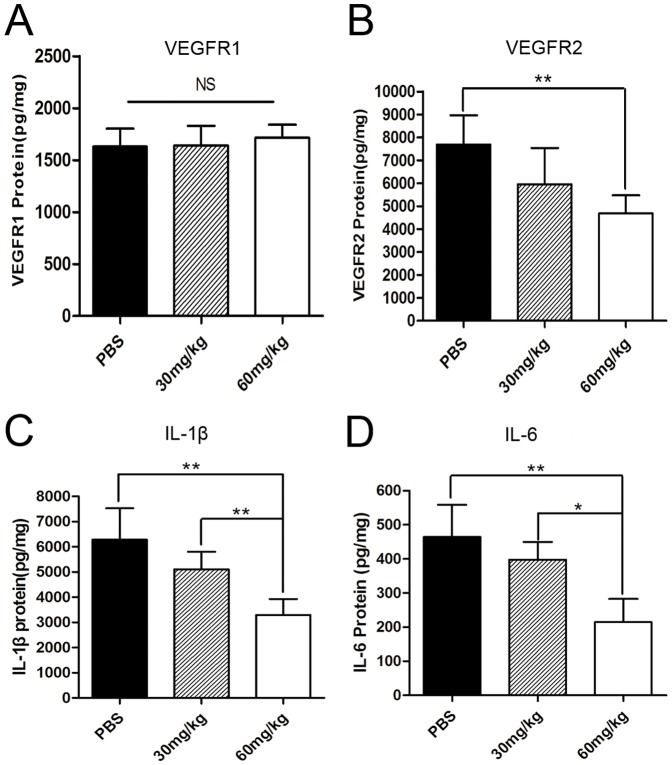
Figure 6. The expression of VEGFR1, VEGFR2, IL-1β and IL-6 proteins detected by ELISA.
The expression of VEGFR2 protein in the mice corneas of the control group, the low-dosage group, and the high-dosage group were 7688.31±1274.27, 5956.76±1579.41 and 4691.27±776.67 pg/mg, IL-1β protein was 6285.41±1246.17, 5107.15±694.55 and 3295.47±631.90 pg/mg, and IL-6 protein was 464.06±94.55, 397.90±51.64, and 214.98±67.90 pg/mg, respectively. The protein levels of VEGFR2, IL-1β and IL-6 were lower in the high-dosage group than that in the control group. There were no statistical differences in the expression of VEGFR1 protein among the three groups. (n = 5, *p<0.05; **p<0.01).

