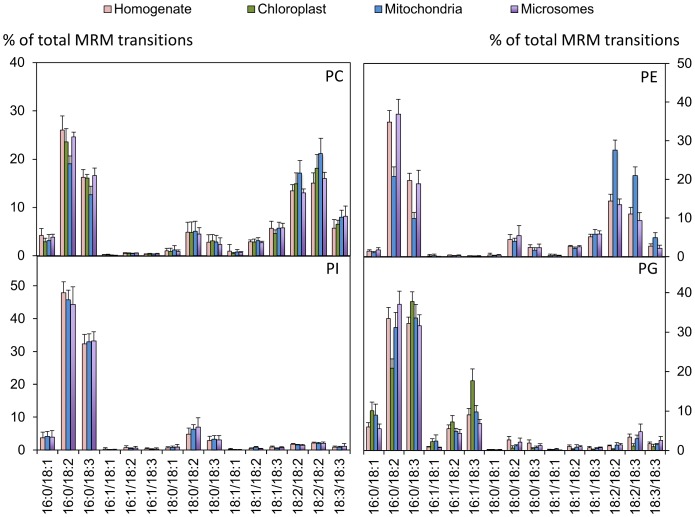
Figure 7. Profiles of PE, PC, PG and PI as analyzed by MRM mass spectrometry in different membrane fractions.
N = 14, 13, 9 and 4 for homogenate, microsomes, plasma membrane enriched fractions and mitochondria-enriched fractions, respectively. Note that there is no PI or PE in chloroplasts, and that the signals obtained were omitted because they were due to contamination. Diagrams of the molecular species in all analyzed fractions can be found in Figure S6.

