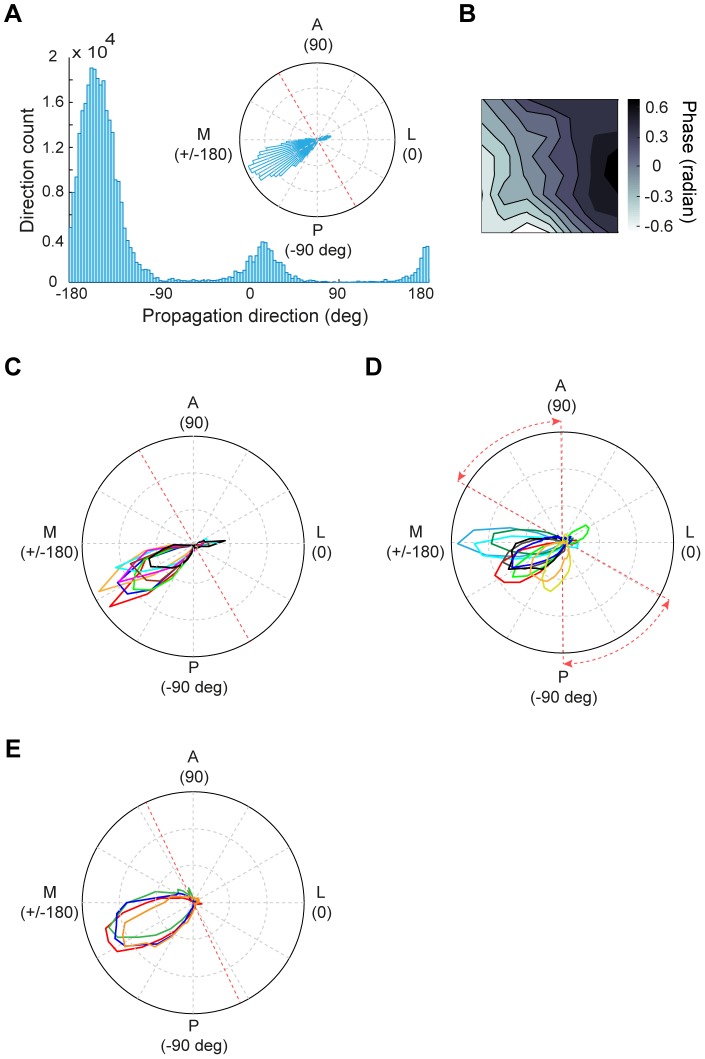
Figure 3. Analysis of wave direction for stimulus-induced responses.
(A) Distribution of wave directions during all trials for the responses to 4-Hz contrast reversal gratings from one experiment. Red dashed line in the inset represents the 17/18 border. (B) Average phase map using the data points within 30° of the peak direction shown in (A). (C) Distribution of wave directions measured with 4-Hz contrast reversal gratings at different orientations from one experiment. Each color represents one orientation. Data were from the same experiment as that shown in (A). (D) Distribution of wave directions measured with 4-Hz contrast reversal gratings for all 10 experiments. Red dashed lines represent the range of the 17/18 border across different experiments. (E) Distribution of wave directions measured with gratings that contrast-reversed at 2, 3, 4, and 5 Hz, respectively, from one experiment. Red dashed line represents the 17/18 border.

