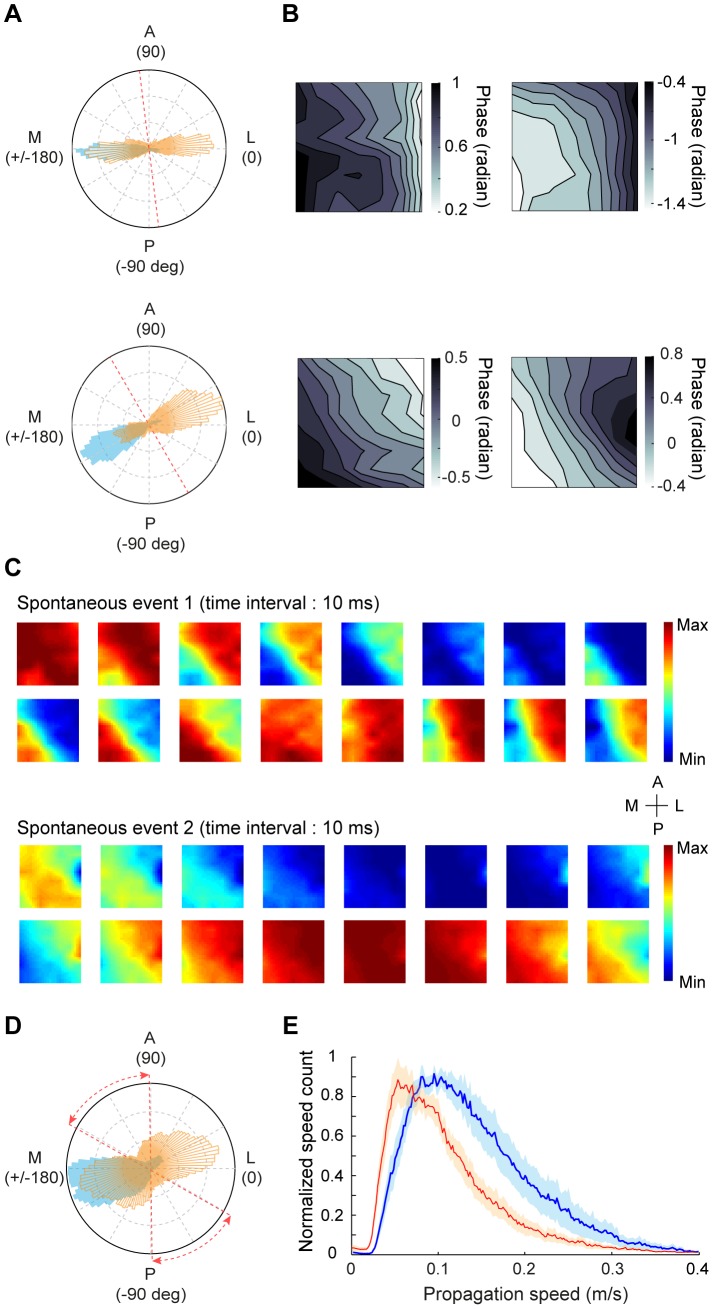
Figure 6. Comparison of wave parameters between spontaneous responses and responses induced by 4-Hz contrast reversal gratings.
(A) Distributions of wave directions for stimulus-induced (blue) and spontaneous (orange) activities measured in two experiments. Red dashed line indicates the 17/18 border. (B) Upper, average phase maps computed using data points within 30° of the two peak directions for the spontaneous activity shown in the upper panel of (A). Lower, average phase maps computed using data points within 30° of the two peaks for the spontaneous activity shown in the lower panel of (A). (C) Snapshots of two example spontaneous events recorded from the same experiment. (D) Distribution of wave directions for stimulus-induced (blue) and spontaneous (orange) activities, averaged from 9 experiments. Red dashed lines represent the range of the 17/18 border across different experiments. (E) Distribution of wave speeds for stimulus-induced (blue) and spontaneous (red) activities for 9 experiments. Shaded region: standard error of the mean.

