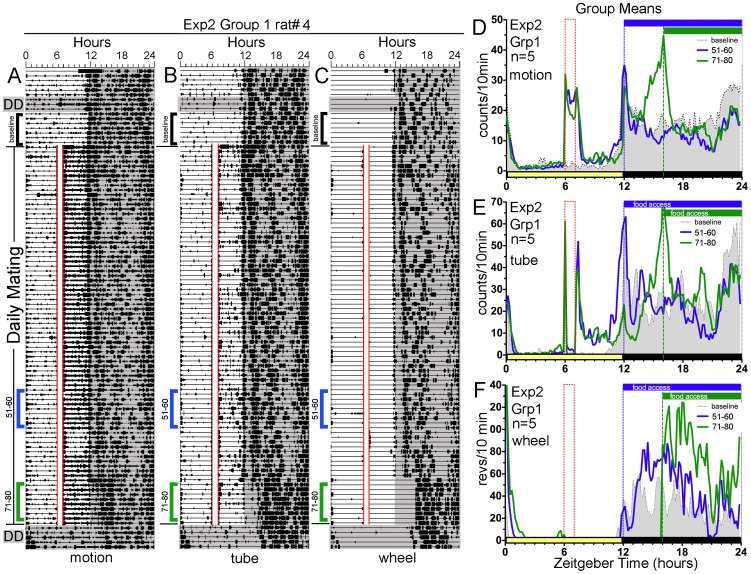
Figure 2. Experiment 2: Most rats fail to anticipate daytime mating when post-coital eating and wheel running are prevented for 6 or 10 h.
Panels A–C. Actograms of home cage motion (A}, mating tube entry (B} and wheel running (C} of a representative rat. Panels D–F. Group mean waveforms of the 5 of 6 rats in Group 1 that showed little (N = 1} or no (N = 4} sex anticipatory activity in home cage motion (D}, mating tube entry (E} and wheel running (F}. The filled (grey} curve represents baseline prior to scheduled mating (the average of the days marked by the upper black bracket to the left of each actogram in Panels A–C}. The heavy (blue} curve represents scheduled mating days 51–60 (the middle blue brackets in A–C, when running wheels were locked from ZT6-12, and food was available from ZT12-24}. The green curve represents days 71–80 (the lower green brackets in A–C, when running wheels were locked from ZT6-16, and food was available from ZT16-24}. The time of food availability is indicated by the horizontal blue (ZT12-24} and green (ZT16-24} bars at the top of panels D–F. See Figure 1 for other plotting conventions.

