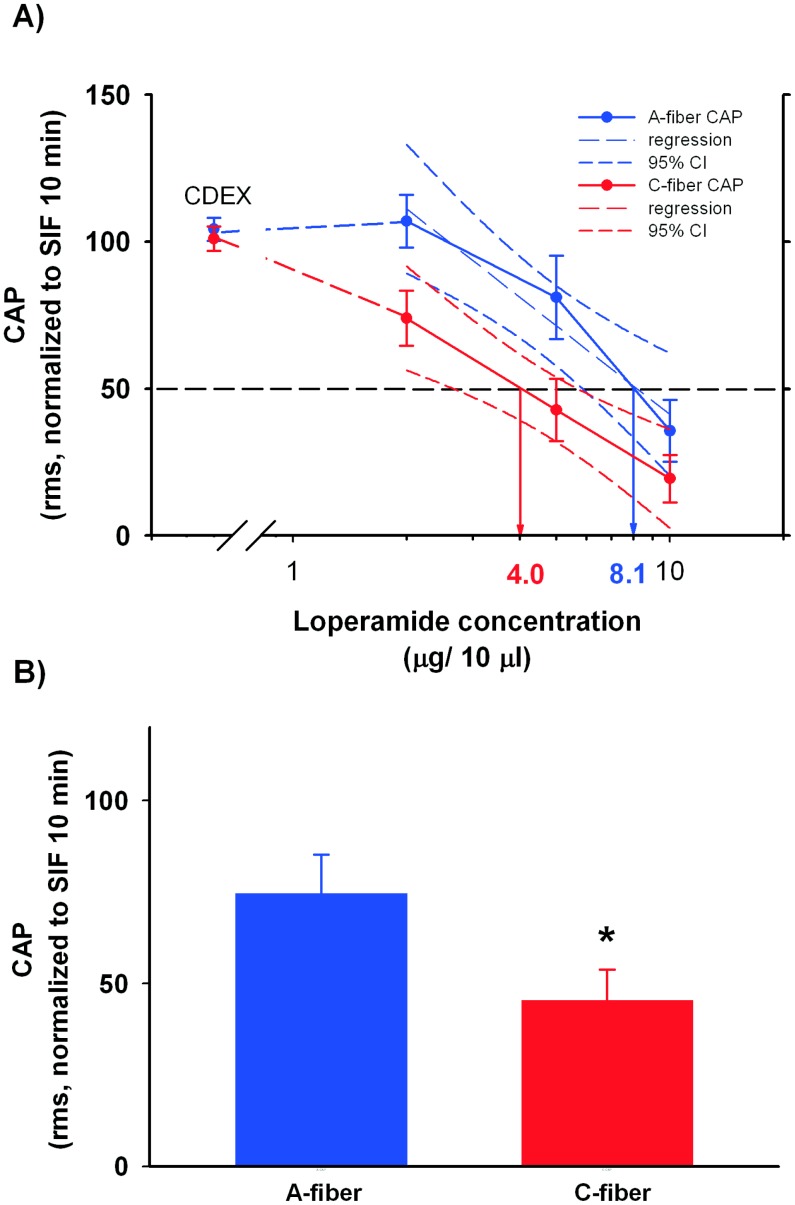
Figure 7. The conduction blockade by loperamide was dose-dependent.
A) Dose response curves for the A- and C – CAPs were plotted, and regression analyses were performed for both to estimate the ED50. For the C-CAP (red symbols), the regression line and the dose response data completely overlap. The ED50 for C-CAP (4.0 µg/10 µl) is lower than the ED50 for A-CAP (8.1 µg/10µl), but the 95% confidence intervals overlap slightly. B) The average A-CAP during loperamide incubation was significantly larger than the average C-CAP (inset, paired t-test, p<0.05, n = 10), suggesting that A fibers are less susceptible to loperamide effects.

