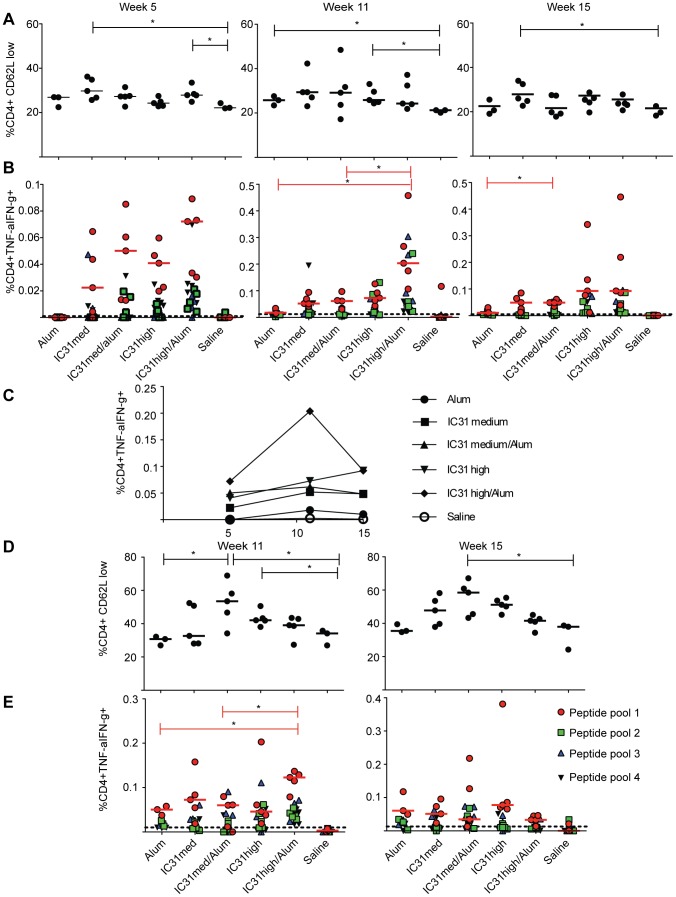
Figure 3. Durable Env-CN54 specific CD4+ T-cell responses are detected following vaccination when Env/alum/IC31 is used as a prime.
(A–C) Mice were primed with Env-CN54 gp140 in combination with either alum alone or a medium (“med”) or high concentration of IC31 with or without alum and then boosted with NYVAC-CN54 at three week intervals. A) Frequencies of activated CD4+ T cells as indicated by low CD62L expression at weeks 5, 11 and 15. Each data point corresponds to a single mouse in the experimental group. B) Percentage of CD4 T cells secreting cytokines (TNF-α and IFN-γ) upon stimulation with four peptide pools covering the full length of Env-CN54 gp140, as determined by ICS. C) Kinetic analysis of the frequencies of cytokine secreting CD4+ T cells following vaccination. Data points correspond to the medians of the frequencies obtained by stimulation with peptide pool 1. D–E) Mice were primed with NYVAC-CN54 and boosted with Env-CN54 gp140 in combination with adjuvants as listed. (D) Frequencies of activated CD4+ T cells as indicated by low CD62L expression at weeks 11 and 15. Each data point corresponds to a single mouse in the experimental group. (E) Percentage of CD4+ T cells secreting cytokines at weeks 11 and 15. For B and E, data points following stimulation with peptide pool 1 (red circles), pool 2 (green squares), pool 3 (green triangles) and pool 4 (black triangles) are distinguished, while the dotted line corresponds to the average obtained upon DMSO stimulation. Bars correspond to median values (medians for peptide pool 1 stimulation only in B and E). *p<0.05.

