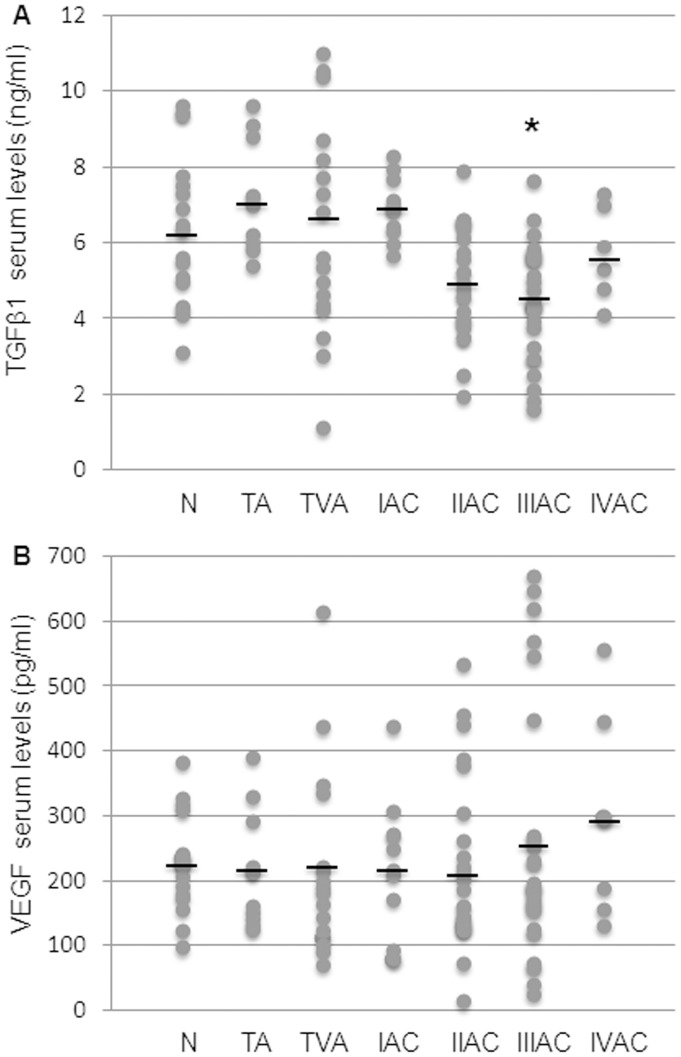
Figure 3. Evaluation of serum levels of TGFβ1 and VEGF during colorectal carcinogenesis.
The levels of TGFβ1 (A) and VEGF (B) were measured in controls and patient groups (N: control; TA: tubular adenoma; TVA: tubulovillous adenoma; I-IV AC: malignant stages of adenocarcinoma). TGFβ1 and VEGF were detected by ELISA and values expressed as ng/ml and pg/ml serum, respectively (see materials and methods). A: dots correspond to single TGFβ1 values and black lines represent the mean values within the experimental groups. Mean values ± SEM: N 6.3±0.4; TA 7.2±0.45; TVA 6.3±0.6; IAC 6.9±0.3; IIAC 4.9±0.3; IIIAC 4.4±0.3; IVAC 5.7±0.5. *Significantly different versus control group (p<0.05). B: dots correspond to single VEGF values and black lines represent the mean values within the experimental groups. Mean values ± SEM: N 227.0±18.7; TA 215.2±31.3; TVA 221.1±36.4; IAC 216.3±34.4; IIAC 205.0±26.6; IIIAC 266.5±38.6; IVAC 295.2±70.2.

