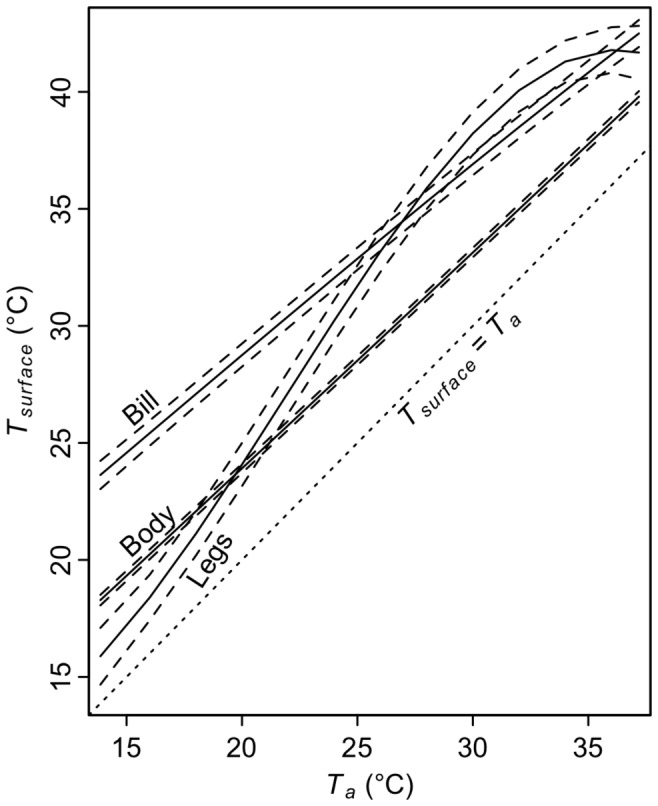
Figure 2. Surface temperature of bill and bill base of song sparrows vs. ambient temperature (Ta).

(A) shows values for bill and (B) presents values for bill base. Black lines = model averaged predictions of linear mixed models ± highest and lowest unconditional standard errors. Gray lines = raw data.
