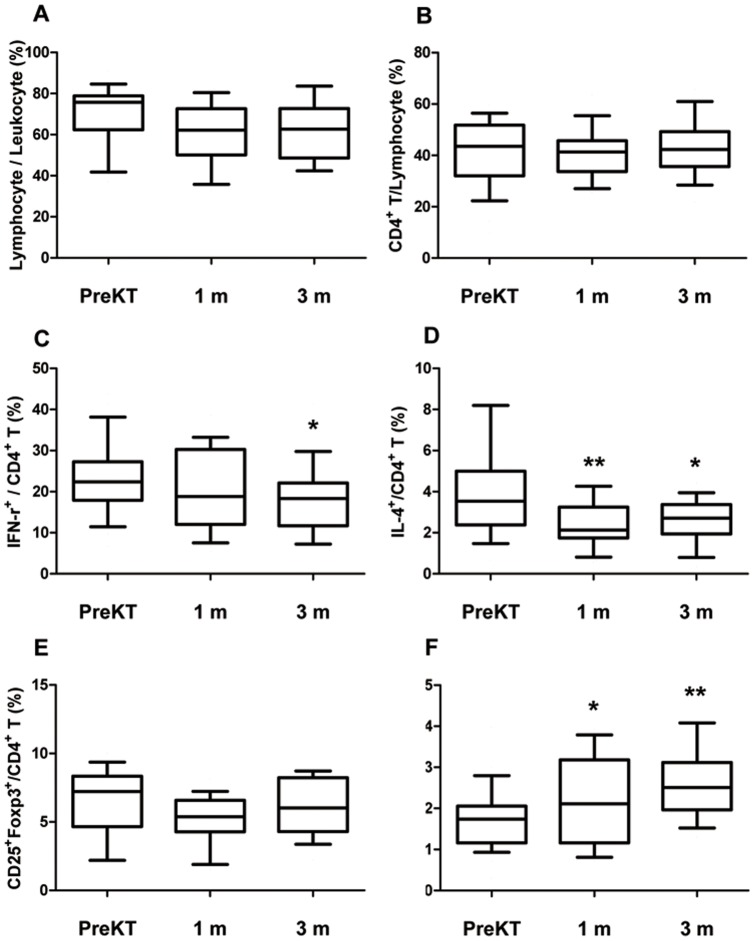
Figure 2. Distribution of lymphocyte and CD4+ T cell subtype at 1 and 3 month after transplantation compared to before transplantation.
PBMC from patients before KT, patients at 1month after KT and patients at 3 month after KT were stimulated for 4 h ex vivo with PMA and ionomycin in the presence of Golgi Stop. The percentage of Target cells was measured by flowcytometry. The frequency (%) of Lymphocyte/Leukocyte cells (A), CD4+T/Lymphocyte cells (B), IFN-γ+/CD4+T cells (C), IL-4+/CD4+T cells (D) CD25+FOXP3+/CD4+T cells (E) and IL-17+/CD4+ T cells (F) in patients before KT, patients at 1month after KT and patients at 3 month after KT. Bars show the means. * P<0.05 vs. PreKT, ** P<0.01 vs. PreKT PreKT, before kidney transplantation; m, month.

