
Figure 3. Quantitation of expressed HA by immunoblotting assay using anti-HA-tag antibody.
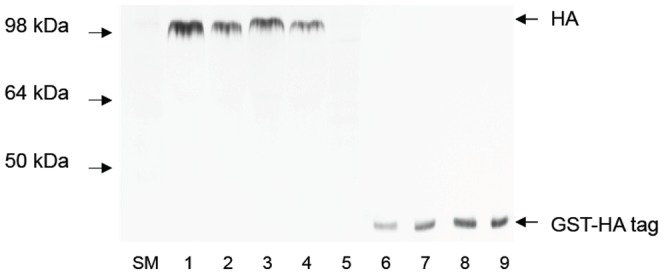
Different concentrations of standard protein GST-HA tag were visualized in the same membrane as HAs. 1–2, 309 HA (10 µl, 7 µl); 3–4, mutant HA HL156-157KS (10 µl, 7 µl); 5, mock infected; 6–9. GST-HA tag 4 ng, 6 ng, 8 ng, 10 ng, respectively. The bands were scanned and quantitated using ImageQuant software (Molecular Dynamics). Amounts of HA were determined from a standard curve of GST-HA tag fusion protein. Standard curves were built for each sample of HA.