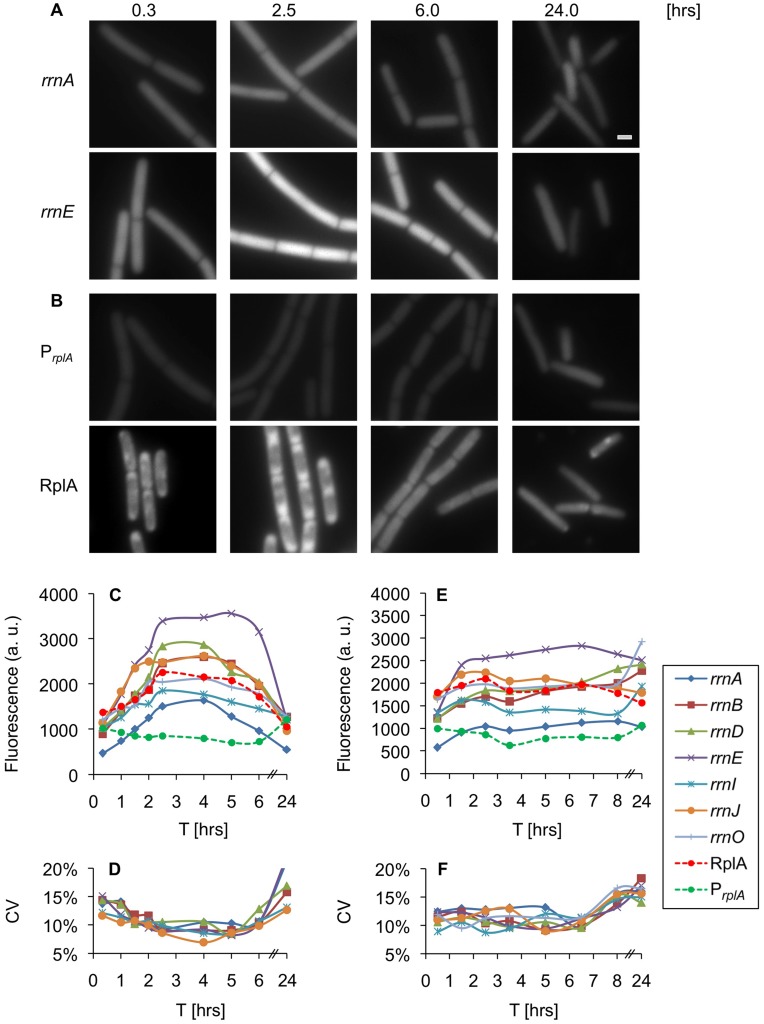
Figure 1. Expression of ribosomal components is dynamic during vegetative growth.
(A–B) Strains carrying PrrnA-gfp (AR13) (A-rrnA), PrrnE-gfp (AR16) (A-rrnE), PrplA-gfp (AR25) (B-PrplA), rplA-gfp (AR5) (B-RplA) were grown in rich medium (CH). Samples were taken at the indicated time points [hrs] and the GFP signal monitored using fluorescence microscopy. All fluorescence images were normalized to the same intensity range. Of note, the localization of RplA-GFP was consistent with previous results [78]. Scale bar corresponds to 1 µm. (C) Strains carrying Prrn-gfp (rrnO, A, B, D, E, I, J), PrplA-gfp or rplA-gfp were grown in rich medium (CH). Samples were taken at the indicated time points [hrs] and the GFP signal monitored using fluorescence microscopy. The data represent the average of three independent biological repeats. Fluorescence from at least 60 cells was measured and averaged for each time point, and is shown in arbitrary units (a.u.) (see Materials and Methods). (D) Variability of GFP intensity among single cells carrying the indicated Prrn-gfp reporter at the different time points described in (C). Coefficient of Variability (CV) was calculated as SD divided by mean (see Materials and Methods). (E) Strains carrying Prrn-gfp (rrnO, A, B, D, E, I, J), PrplA-gfp or rplA-gfp were grown in minimal (S7) medium and samples processed as in (C). (F) Variability of GFP intensity among single cells carrying the indicated Prrn-gfp reporter at the different time points described in (E). Coefficient of Variability (CV) was calculated as SD divided by mean (see Materials and Methods).

