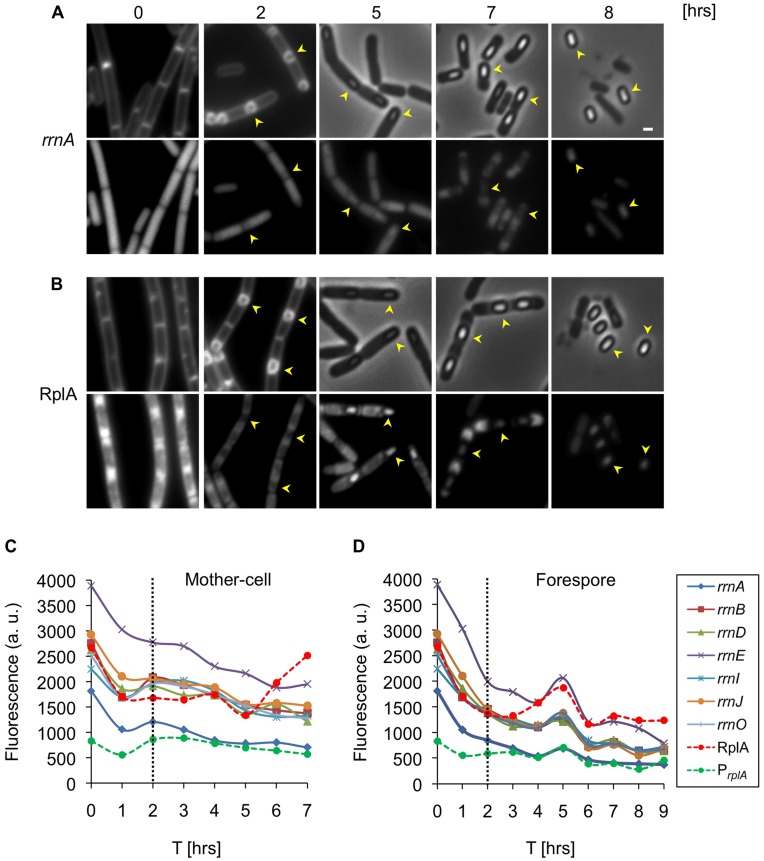
Figure 3. Translational machinery is differentially expressed within mother-cell and forespore.
(A–B) Strains carrying PrrnA-gfp (AR13) (A) or rplA-gfp (AR5) (B) were induced to sporulate. Samples were taken at the indicated time points [hrs] and the GFP signal monitored using fluorescence microscopy. FM4–64 membrane stained cells (0 and 2 hrs) and phase contrast images (5–8 hrs) are shown in the upper panels and corresponding GFP fluorescence images (0–8 hrs) in the lower panels. Arrowheads designate the position of forespores. Scale bar corresponds to 1 µm. (C–D) Strains carrying Prrn-gfp (rrnO, A, B, D, E, I, J), PrplA-gfp or rplA-gfp were induced to sporulate. Samples were taken at the indicated time points [hrs] and the GFP signal from predivisional cells (0–2 hrs) and from mother-cell (C) and forespore (D) monitored using fluorescence microscopy. The data represent the average of 2 independent biological repeats. Fluorescence from at least 100 cells was measured and averaged for each time point and is shown in arbitrary units (a.u.) (see Materials and Methods).

