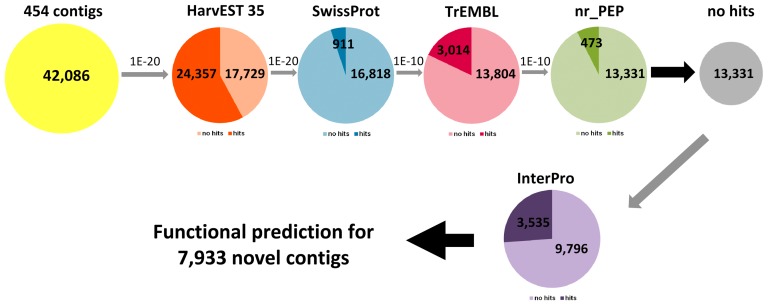
Figure 3. The multilevel process of filtering for functional assignment of ETC transcripts not present in HarvEST35.
Dark shaded regions in pie charts indicate the number of hits in databases whereas light coloured regions display the number of transcripts not fulfilling the respective similarity criteria. Non-hitting sequences were further compared to the next protein database with decreasing stringencies (BlastX cut-offs 1E-20 to 1E-10). InterPro search for functional domains was employed for the sequences without sufficient similarity.

