
Figure 1. Percentage of necro inflammatory grading (left), fibrosis staging (middle) and steatosis (right) according to the presence or absence of GD.
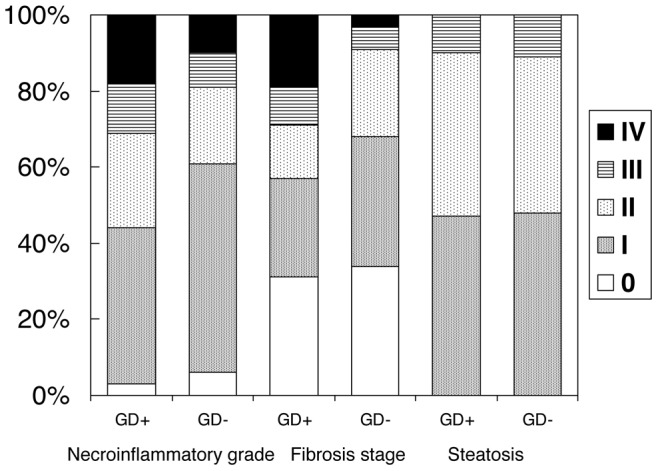
For necroinflammatory grade (IV = grade IV, V, VI and VII together). Analysis for trend: Necroinflammatory grade p = 0.01, Fibrosis stage p = 0.0001, Steatosis not significant (p = 0.7).