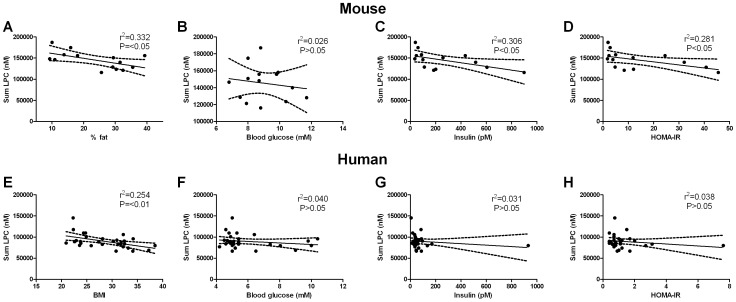
Figure 5. Relationship between plasma lysophosphatidylcholine (LPC), adiposity and indices of insulin resistance in high fat fed mice (A–D) and lean, obese and obese type 2 diabetic humans (E–H).
The association between circulating LPC and percent body fat (A), blood glucose (B), plasma insulin (C) and HOMA-IR (D) in high fat fed mice. The association between circulating LPC and BMI (E), blood glucose (F), plasma insulin (G) and HOMA-IR (H) in the human cohort. Data are presented as line of best fit with 95% confidence intervals.

