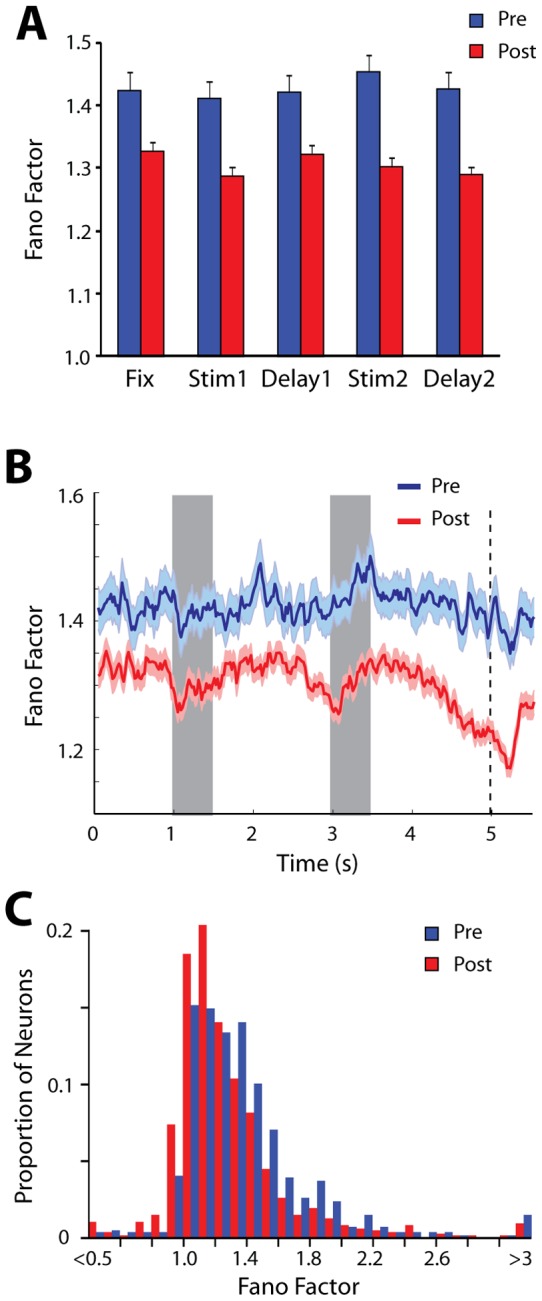
Figure 2. Average Fano Factor.

A) Average Fano Factor values during the fixation period, stimulus presentation period and delay period for all neurons with significant responses to the stimuli (N = 518 pre; 741 post-training). Error bars represent the standard error of the mean. B) Time course of Fano Factor in 100 ms successive bins. Shaded area around each curve represents the standard error of the mean. Gray bars in the plot represent the time of stimulus presentation; vertical line, the time of reward in the pre-training condition and the time of choice targets appearance in the after training condition. C) Distribution of Fano Factor values computed during the stimulus period, for all neurons before and after training.
