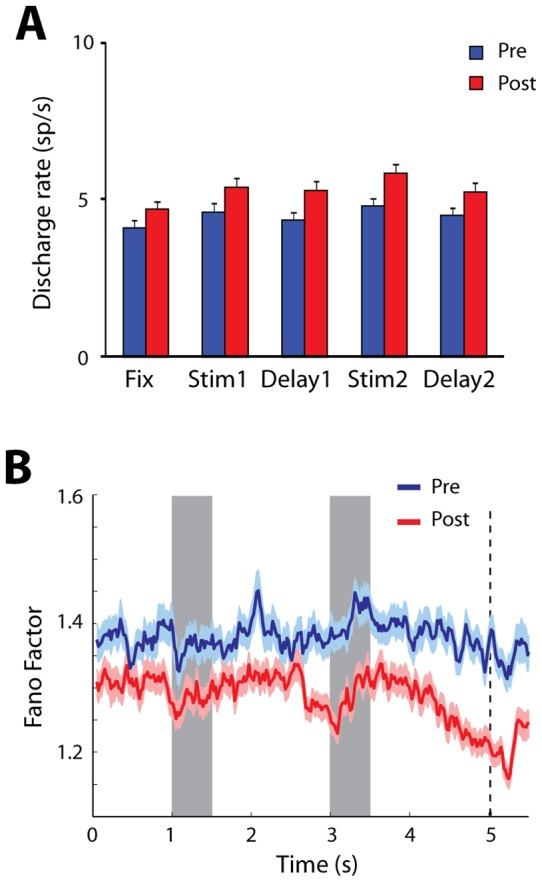
Figure 3. Influence of discharge rate.

. A) Mean discharge rate across all stimulus conditions for neurons with stimulus responses, recorded before and after training. B). Time of course of Fano Factor for neuron samples recorded before and after training, matched for mean discharge rate. Conventions are the same as in Figure 2B.
