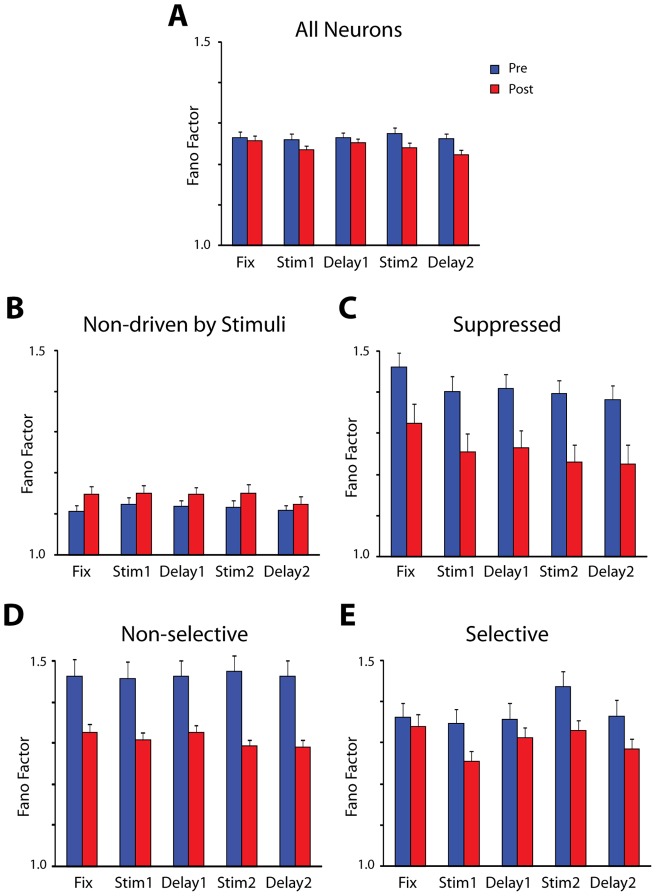
Figure 4. Average Fano Factor values for neurons with different properties.
A) All recorded neurons, whether they responded to the task or not (N = 1279 pre; 1295 post-training). B) Neurons that did not respond to any aspect of the task (N = 583 pre; 498 post-training). C) Neurons that responded during a task period only with a suppressed response, and no excitatory response in any other period (N = 149 pre; 101 post-training). D) Neurons driven by the task but non-selective for the visual stimuli, in any task period (N = 313 pre; 288 post-training). E) Neurons selective for the visual stimuli (N = 175 pre; 207 post-training).

