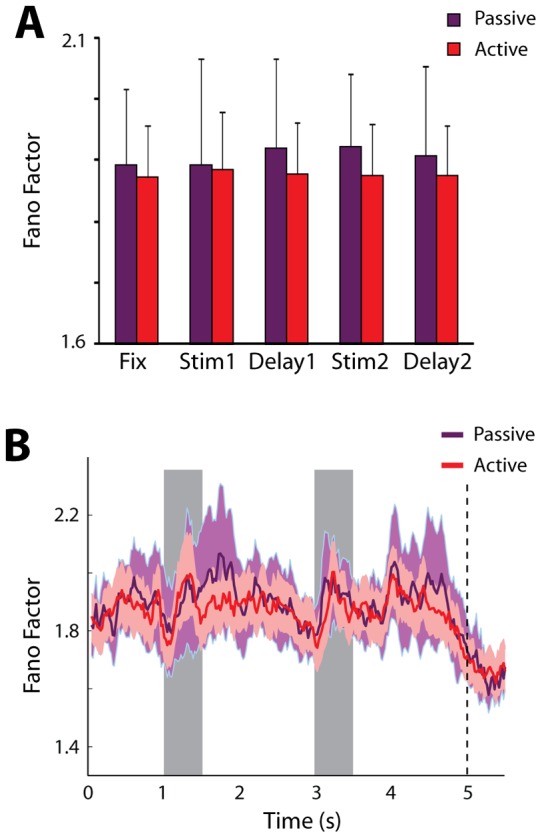
Figure 6. Variability during passive fixation after training.

A) Average values of Fano Factor during the active execution of the Match/Nonmatch task and during passive presentation of the same stimuli, after training. The exact same neurons (N = 139) are compared in the two conditions. B). Time course of Fano Factor changes during active and passive presentation.
