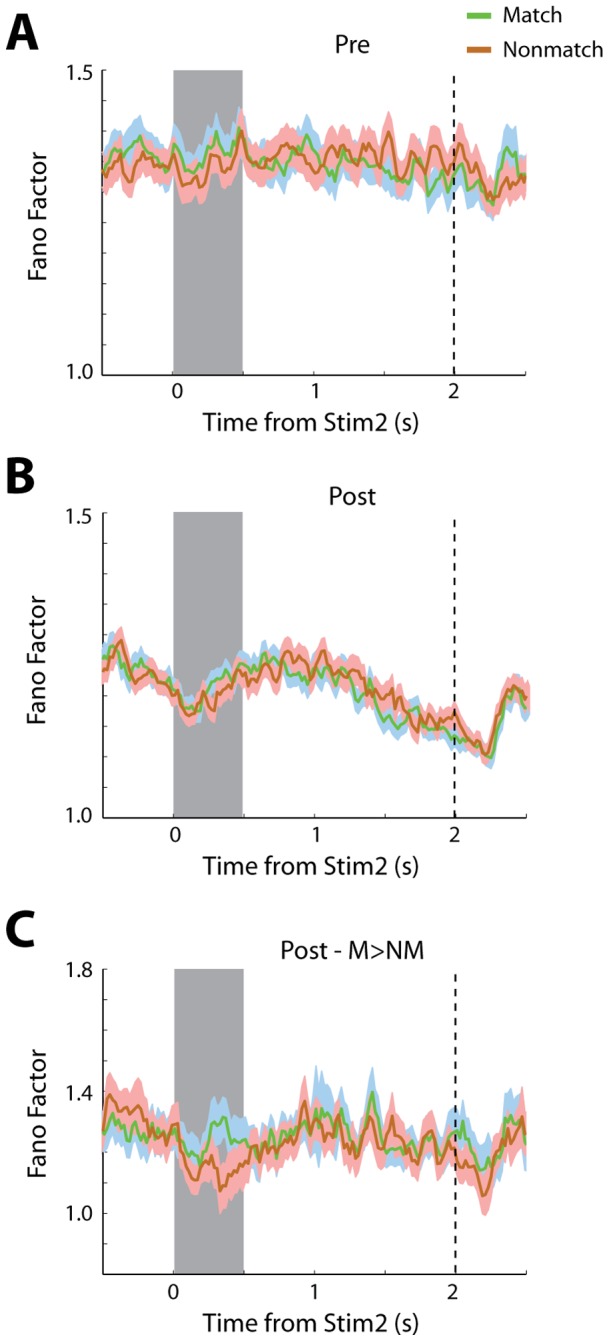
Figure 7. Variability for match and nonmatch stimuli.

A) Time course of Fano Factor values from all neurons recorded prior to training plotted separated by trials that contained Match and Nonmatch stimuli, after training. B). Time course of Fano Factor values for all neurons recorded after training. C) Time course of Fano Factor values for neurons recorded after training with significant preference for a match over a nonmatch stimulus (N = 53).
