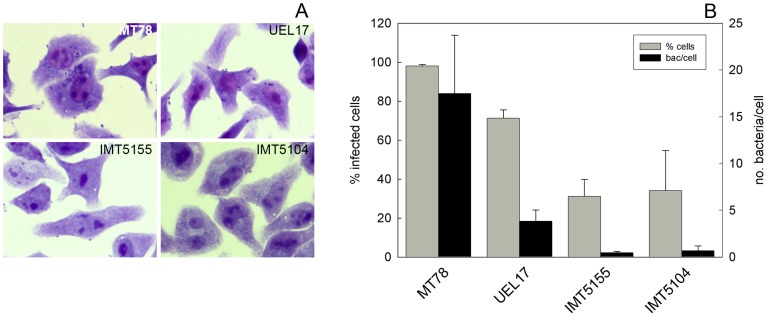
Figure 5. Association of APEC with HD11 chicken macrophages.
Cells were infected at a MOI of 150 CFU/cell as described in Section 2.4. (A) At 6 h p.i., the association of bacteria with macrophages was visualized by Giemsa staining. Magnification is 1000×. (B) Graph shows percentage of infected cells (grey bars) and number of associated bacteria per cell (black bars) for each strain. Data are mean ± standard deviation of three experiments performed in triplicate. 100–200 cells were counted in each sample.

