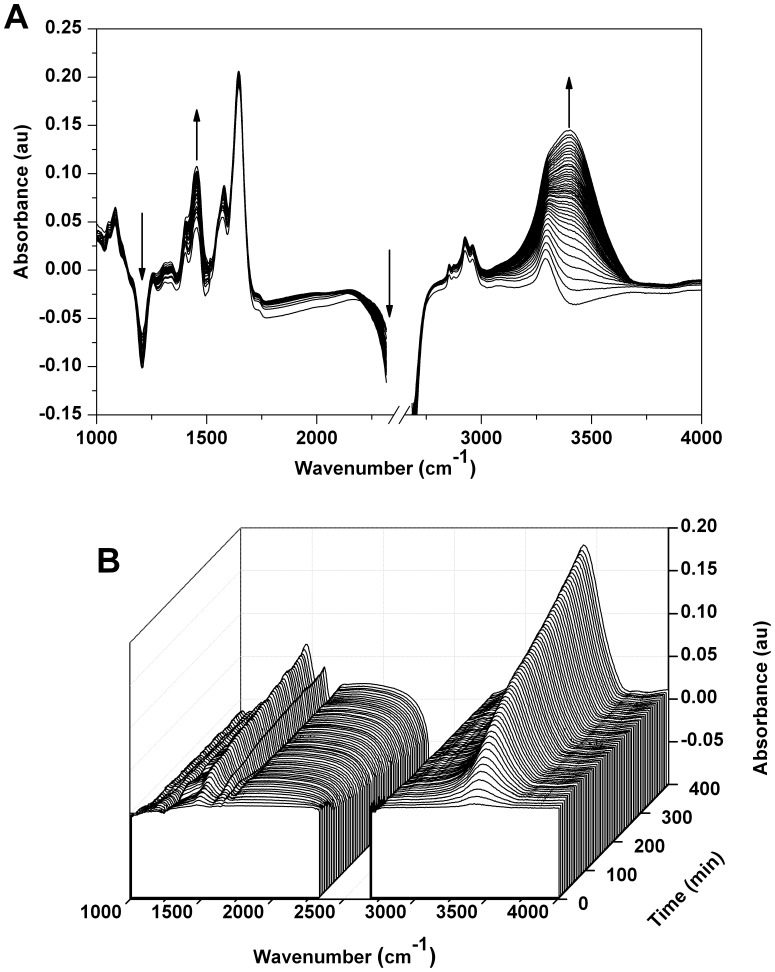
Figure 2. FTIR spectromicroscopy difference spectra of Rat-1 Fibroblasts.
FTIR spectra from a cluster of Rat-1 cells grown on a CaF2 optical slide (∼60% coverage). Spectra were recorded (25×25 µm2 aperture) over 360 minutes after washing the cells with DMEM prepared with 100% 2H2O. A, a two-dimensional plot depicting the absolute absorbance spectra after subtracting the background (an area with 2H-O-2H but no cells). B, the same data plotted in three dimensions in which the initial spectrum (defined as t = 0) of a cell cluster was used as the reference. In both A and B the spectra are recorded every 5 minutes. The bands at ∼3400 cm−1 (1H-O-2H stretch) and ∼1450 cm−1 (1H-O-2H bend) increase over time while the bands at ∼2300 cm−1 (shoulder of the 2H-O-2H stretching mode) and ∼1225 cm−1 (2H-O-2H bend) decrease over time.

